Introduction
User Interface
Top Banner
The top banner features:
- Department Logo
- Name of Application
- Name of Bureau
- Name of Governor
- Name of Agency Secretary
- Useful Links
- About Information
- Help Documentation
- Feedback Link
- Social Media Links
Left Sidebar
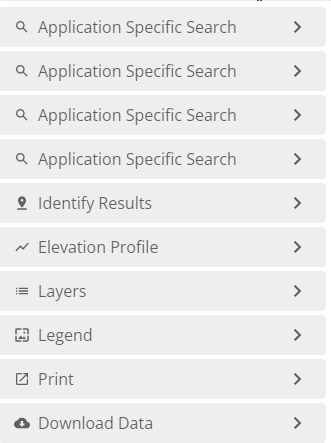
The collapsible left sidebar includes "widgets" or tools that provide:- Application Specific Search Functions
- Identify Results
- List of GIS Data Layers Available for Mapping
- Map Legend
- Print Functionality
- Download Data Functionality
- Bookmarks
Interactive Map
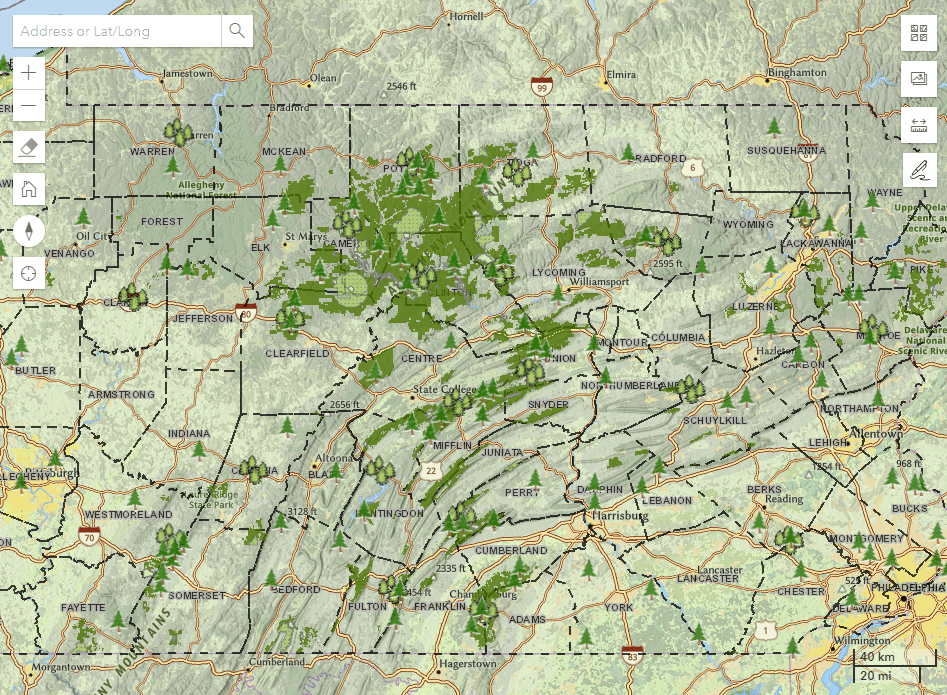
The large interactive map includes the following useful components:- Navigation Functions
- Map Themes
- Selection of Basemaps
- Swipe Tool
- Measure Tool
- Annotation Tool
Search Results Table
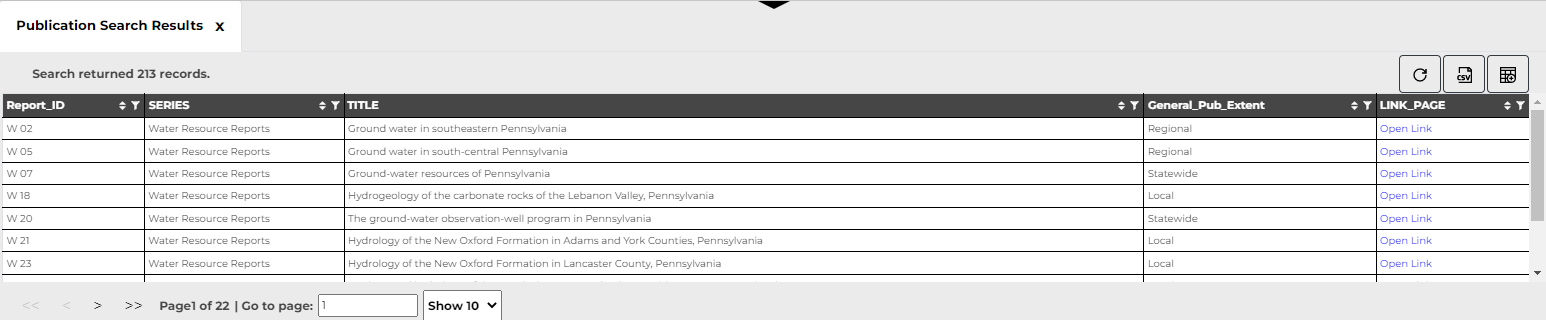
The collapsible search results table that appears at the bottom of the screen provides tabular relevant information when a search is performed for one of the following:- Water Wells and Springs
- Publications
- Surficial Geology
- Bedrock Geology
- Quarries
Accessibility
Our maps leverage the W3C Accessibility Standards to ensure the applications and experiences you create are usable by a wide range of audiences. We plan to continue to improve accessibility with each release.| Action | MapView behavior |
|---|---|
| Drag | Pan |
| Double-click | Zoom in at the cursor |
| Ctrl+Double-click | Zoom out at the cursor |
| Scroll forward | Zoom in at the cursor |
| Scroll backward | Zoom out at the cursor |
| Right-click+Drag | 2D-rotate |
| Shift+Left-click+Drag | Zoom to the extent of the drawn graphic |
| Arrow Keys | Nudge the view to left, right, up or down |
| N | Adjust the view to point north |
| A | Rotate the view counterclockwise |
| D | Rotate the view clockwise |
| + | Incrementally zoom in at the center of the map |
| - | Incrementally zoom out at the center of the map |
| Drag with one or multiple fingers | Pan |
| Double-tap with one finger Zoom | Pan at the finger position |
| Two finger pinch in/out | Zoom out/in |
| Move two fingers in clockwise or counterclockwise direction | Rotate |
Navigation
Search
Selecting the magnify glass expands a text box in which an address or lat/long is to be entered. After entering the information, click on the magnifying glass again to perform the search. The map will zoom to and recenter on the requested location.
Place names may also be entered and may result in a drop-down list of choices. Lat/long will be accepted as decimal degrees in several formats:
- 76.94W 40.35N
- -76.94, 40.35
- X:-76.94 Y:40.35
- Place Names
- Addresses
Zoom
The + and - buttons will zoom the map in and out at predetermined intervals. Alternatively, you can zoom in/out with the mouse wheel. On mobile devices, you can zoom in/out using the traditional pinching motion on your screen.
Home
This button will return the map to its original orientation and scale (shows the full extent of Pennsylvania and north to top).
Scale Bar
In the lower right corner of the map view, the scale bar and numbers show the real-world distance represented by the map view. Scale units are in kilometers (km) and miles (mi) at the home extent, but they will switch to meters (m) and feet (ft) as you zoom way in.
Layers
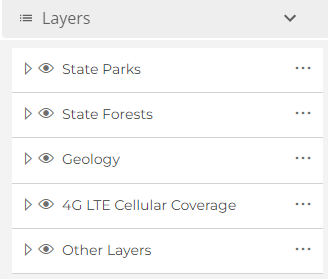
Layer Grouping
Data layers are grouped together under common themes. The main groupings in PennEnviroScreen are:
- PennEnviroScreen Score
- Environmental Justice Areas
- Environmental Justice Indicators
- Reference Layers
Note: Layers and groups are different for each application.
Group Layer Expansion
Each data layer grouping has an arrow to the left of its name. When the arrow is clicked, the group layer will expand to show the data layers it contains. Most of data layers in the expanded list will be individual layers, but some will contain their own sublayers. These lower order group layers also have an arrow to the left of their names.
Reference Layers Group
Reference Layers group is a special group that contains multiple groups and layers that work as reference points to visualize data.
Visibility Control
The checkbox beside each data layer allows you to turn its visibility on and off. A layer and its parent layer must have their checkboxes checked for the layer to be visible. If the checkboxes are checked and the data is not visible, then either (1) the map zoom level is outside of a preset visibility range for the data or (2) the data fall outside of the map area shown on the screen. As stated in the opening paragraph of this section, when a layer name is shown in dark gray, the zoom level is appropriate for showing the data.
Additional Options
The ellipsis icon to the right of each data layer will show additional options for the layers:
-
Go to Full Extentzooms the map to the full extent of the data layer (collapse the left sidebar to view completely)
-
Opacity Modifiersallow you to increase or decrease the transparency of the data layer on the map
Legend
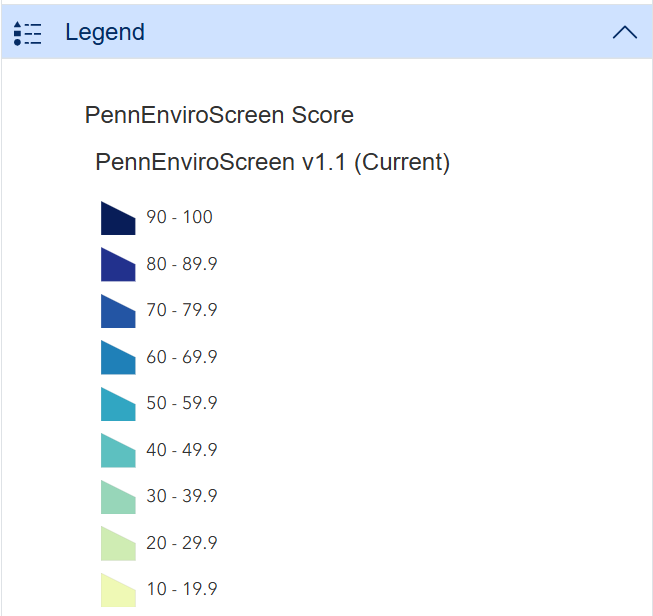
The Legend widget in the left sidebar shows the full symbology of all visible datasets (i.e., layers) on the map, regardless of whether or not they are in the map view. When no layers are set to visible, no symbols are shown.
Note: The legend contents depend on the layers visible and differ by application.
Identify Results
The Identify operation in mapping allows users to interactively select features on a map to retrieve information about them, such as attributes and spatial details. It facilitates efficient exploration and analysis by providing immediate access to feature-specific data within the map view.
The Identify Results widget enables users to retrieve and display information from visible data layers based on a map click. For instance, when clicking on the map with visible bedrock geologic units, the widget returns the names and descriptions of nearby units. Note that the number of results may vary based on the map scale, prompting users to zoom in for more precise identification if needed.
-
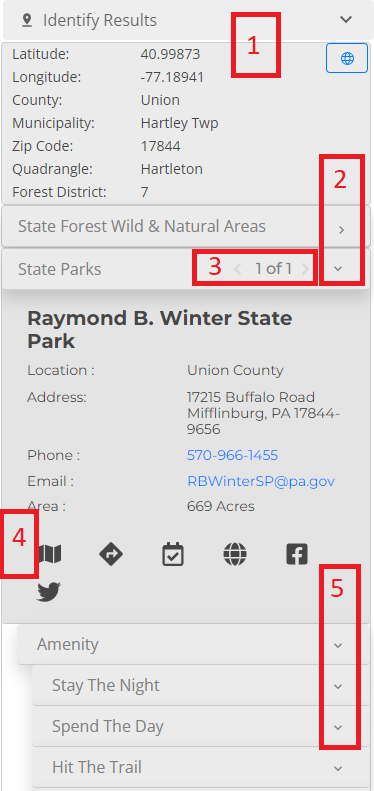
: "Quick ID" - The "Quick ID" section provides reference information about where you clicked on the map including: latitude and longitude coordinates, elevation, and a link to check the weather. Also included in the quick ID section is information on the Administrative Boundaries, Legislative Boundaries, and Protected Lands & Waters.
- : Within the "Quick ID" section, information on Administrative Boundaries, Legislative Boundaries, and Protected Lands & Waters are grouped into expandable headings. To expand the information within these headings click on the carrot to the right of the heading.
- : The pin icon on the far right of the headings for Administrative Boundaries, Legislative Boundaries, and Protected Lands & Waters allows the user to "pin" that section, forcing the section to remain expanded for multiple clicks on the map whereas without it pinned, it would reset on each click.
-
: "Layer ID" - The "Layer ID" section of the identify functionality provides information about the layers (datasets) that are turned on in the Layer list and visible and present at the clicked location on the map.
- : Each layer that is returned upon clicking is shown in an expandable card. Simply click on the card title (layer name) to expand and minimize a card. The card contains information about the specific layer at the location clicked on the map. These cards enable users to explore and access data from different layers with just one click on the map.
- : Some layers will have additional functionality beyond the layer information, available though a series of icons at the bottom of the card. This additional functionality includes: highlight & zoom to the feature, driving directions, PDF maps, and more.
- : When clicking to identify on the map, it is possible to obtain multiple results within the same layer (for instance there may be stacked points, or points very close to each other). To navigate through these multiple results, utilize the pagination feature at the far right of the card header.
Elevation Profile
The Elevation Profile widget in the left sidebar will produce a surface profile along a user-defined transect like the one shown in the image below.
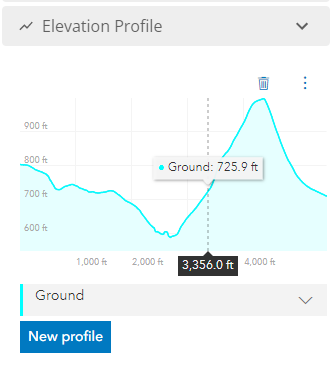
To start the transect, click on the option “New Profile” and proceed with the following steps:
- Click and release the left mouse button at the desired starting point on the map
-
Move the mouse away from the starting point(a black dashed line extends from the starting point to the mouse’s position, which will be shown by a black crosshair)
-
Click the left mouse button again to insert a waypoint(a waypoint can be used to change the direction of the transect)
- Clicking the down arrow beside the word “Ground” will expand a list of statistics related to the line shown in the graph
- Placing the mouse cursor within the graph will show a vertical, gray dashed line with a label indicating the ground elevation and a corresponding white circle will appear on the map
- As the cursor is moved across the graph, the ground elevation values will change and the white circle on the map will move along the transect line
The vertical ellipsis in the upper right corner of the widget frame will open a menu for profile settings. Use this menu to choose the measurement units to show on the graph and the scaling behavior of the X-Y axis. If “Uniform chart scaling” is checked, the X and Y axis will have the same scale. If it is not checked, the profile will have a vertical exaggeration.
GPS
The GPS widget in the left sidebar will allow users to Add GPS Points on Map like the one shown in the image below.
The GPS widget enables users to add GPS locations on Map either by inserting Label, Latitude and Longitude or by uploading the CSV file to add Locations in Bulk.
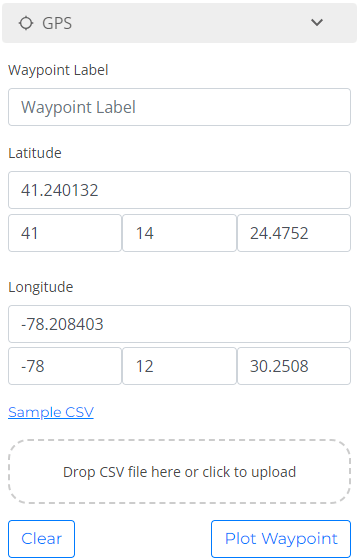
- After inserting Label, Latitude and Longitude Click on Plot Waypoint. The site will then add and zoom to that WayPoint on the Map.
- You can upload a CSV file either by dropping and click on Upload. The map will add your points and zoom to all WayPoint's on the Map.
- A sample CSV file can be downloaded by clicking on SAMPLE CSV Link.
Searches
Water Well & Spring Search
The Water Well & Spring Search enables users to search for a variety of data on water wells or springs in Pennsylvania. The data is stored in a database that is popularly known as the Pennsylvania Groundwater Information System (PaGWIS). The history of the database, the accuracy of the data, and an explanation of all the fields in each retrievable data package is explained in a user guide that can be downloaded from this link: DCNR E-Library
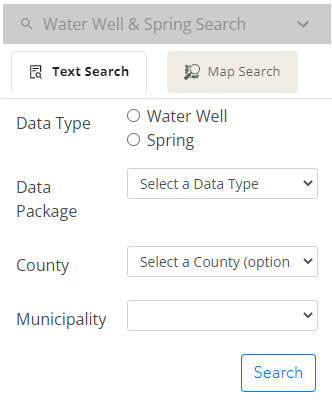
Because of the large volume of data in the source database, the data symbols will only display when the layer (water wells or springs) is turned on and the map view is zoomed in on an area of interest. Also for this reason, searches are limited to one of the following:
- Local Areas
-
Individual wells or springs(identified by a unique ID in the database)
-
All wells associated with a defined constraint(e.g., wells drilled by a specific driller)
- Turn on visibility for the Natural Resources group layer and Water Wells and/or Springs sublayers (depending on the topic of your search)
- Choose between Text Search or Map Search
- Select the Data Type—Water Well or Spring
- Select the Data Package
- If doing a Text Search, fill in locational or other information to narrow the search
- If doing a Map Search, zoom in to the area of interest to the point where you can see well water and/or spring symbols, then draw a rectangle or circle to define the search area (drawing tools will be disabled until the zoom level is adequate to see symbols)
- If doing a Water Well search, check the box near the bottom of the search menu to include unlocated wells within intersected municipalities if you wish to have that data (water wells that do not have coordinates but were assigned a municipality)
- Click the Search button at the bottom of the search menu
- Check the search result table displayed at the bottom of the screen for the retrieved data (see the section Search Result Tables below)
Publication Search
Use this widget to search for current (4th) Pennsylvania Geological Survey publications and for selected previous Pennsylvania Geological Surveys and U.S. Geological Survey publications.
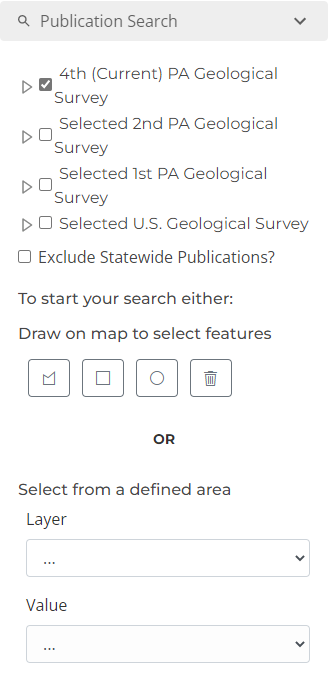 To search for publications:
-
Select the publication series to be searched
- Checking a group header (publishing organization) will cause all publication types within that group to be selected
- To be more restrictive, expand the group header list (do not check it) and check the desired publication series from the underlying list
- If desired, choose to exclude publications with statewide coverage from your search results (this option is immediately under the list of publishers)
-
Select the area where you would like to perform the search using one of two methods
- Use a drawing tool
- Use the drop-down menus to pick a county or 7.5-minute quadrangle
- Check the search result table displayed at the bottom of the screen for the retrieved data (see the section Search Result Tables below)
- Click the link provided in the Link_Page column of the Publication Search Results table to open a landing page for the publication (see example of landing page below)
Surficial Geology Search
The Surficial Geology Search allows you to search for surficial geologic units across mapped areas of Pennsylvania. Most of these areas represent reconnaissance mapping at a 1:24,000 scale.
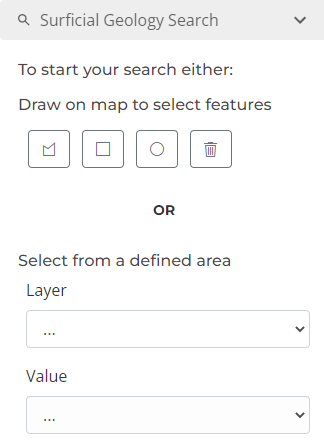 To search for surficial geologic units:
- Turn on visibility for the Surficial Geology group layer and Surficial (Quaternary) Geology sublayer to see the areas in Pennsylvania that have surficial mapping data
- Use the drawing tools to search for all surficial geologic units within a defined area
- Use the Region and Area drop-down selectors to search across all mapped areas for a particular surficial geologic unit
- Check the search result table displayed at the bottom of the screen for the retrieved data (see the section Search Result Tables below)
Bedrock Geology Search
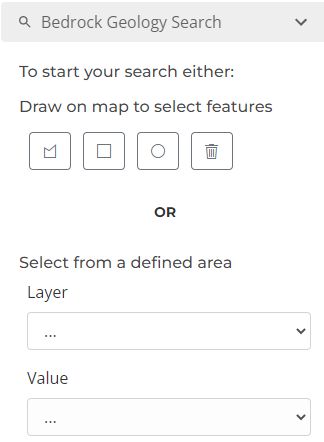
The Bedrock Geology Search allows you to search Pennsylvania’s 1:250,000-scale bedrock geology dataset for all bedrock geologic units in defined areas or for bedrock geologic units by name, age, or lithology across the state.
To search for bedrock geologic units:- Turn on visibility for the Bedrock Geology group layer and Geologic Units sublayer
- Use the drawing tools to search for all bedrock geologic units within a defined area
- Use the Region and Area drop-down selectors to search the state for bedrock geologic units by name, geologic age, or primary lithology
- Check the search result table displayed at the bottom of the screen for the retrieved data (see the section Search Result Tables below)
Quarry Search
To find information on nonfuel-mineral production in the state, use the Quarry Search tool. The data being searched were collected from individual operators in 2015 and may not represent all quarries, as the survey was voluntary.
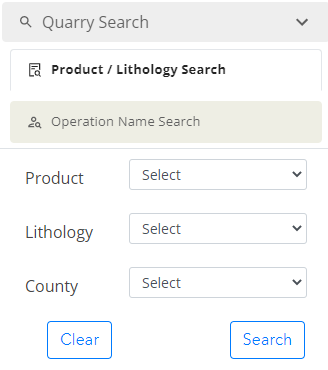 To search for quarries:
- Turn on visibility for the Natural Resources group layer and the Quarry Operations (2015) sublayer
- Select Imagery for the basemap to see the quarries when zoomed in
- Use the Operation Name Search tab and select a named operation from the drop-down list to search for a specific quarry
- Use the Product/Lithology Search tab to search by any combination of product, lithology, and/or county (must select at least one value from at least one of the three drop-down lists)
- After making your selections in either quarry search tab, click on the Search button to perform the search (the quarry points will be circled in blue, and the map view will zoom to the area of the selections)
- Check the search result table displayed at the bottom of the screen for the retrieved data (see the section Search Result Tables below)
Searches
Spray Locations Search
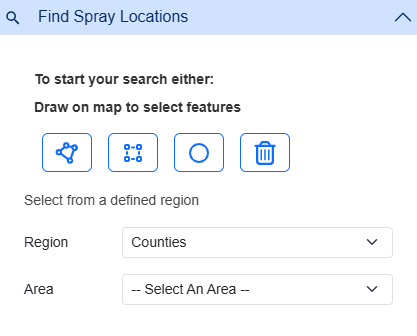
The Spray Locations Search allows you to search Pennsylvania’s Spongy Moth Spray Blocks dataset in defined areas or for county across the state.
To search for spray locations:- Turn on visibility for the Insect Spray Blocks layer
- Use the drawing tools to search for all spray blocks within a defined area
- Use the Region and Area drop-down selectors to search the state for spray blocks by county
- Check the search result table displayed at the bottom of the screen for the retrieved data (see the section Search Result Tables below)
Trace Downstream Tool
The trace downstream tool is used to identify the flow path of water or other substances from a starting point (such as a point source of pollution) to downstream locations (such as a water intake or a downstream community).
All the tools in this app are presented as wizards: a user interface element that guides users through a complex or multi-step process by breaking it down into a series of smaller, more manageable steps or tasks. The wizards consist of a series of forms, each of which presents the user with a clear and concise set of instructions or questions, and provides feedback on their progress.
The following is an explanation of each step in the process.
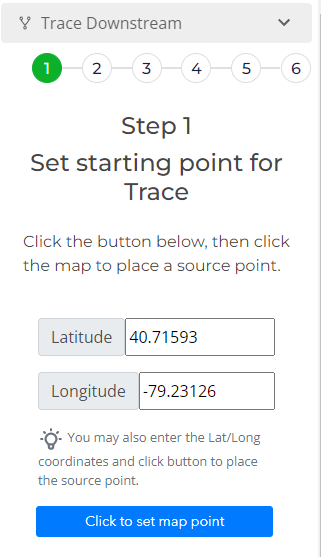
Here, you have the option to enter latitude and longitude coordinates or to place a point by clicking on the map using the provided button. Once you have placed the point, you can proceed to step 2.
The starting point is important because it serves as the reference point for the trace downstream analysis. The trace downstream tool uses the starting point as the origin for tracing the flow of water or substances downstream, and can identify the flow path and potential impact of the pollutant on water quality or other environmental factors.
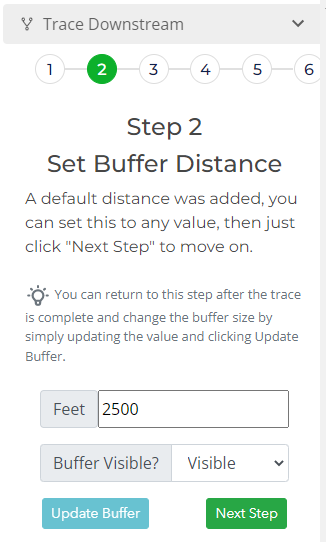
A buffer distance (entered in feet) around a trace downstream line is a zone or area created around the trace downstream line, which represents the path of water or substances flowing downstream from a given starting point. The buffer represents the potential impact zone of the flow path, and is often used to identify and assess the potential impact of pollutants or other environmental factors on nearby features or resources.
The buffer is used to select locations that are affected, which includes water intakes, wells, public water supply service areas (complete list available in step 6 ).
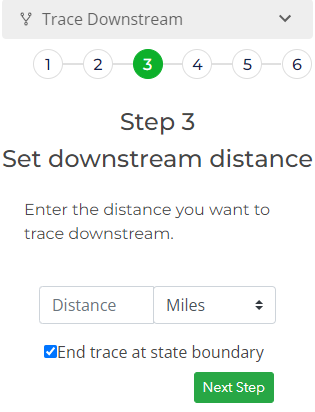
The downstream distance measurement in a trace downstream refers to the length of the path or route that a pollutant or substance would travel from a starting point to a downstream location. This measurement is typically calculated based on the flow direction and velocity of the water or substance, as well as other physical and environmental factors that may influence the path of the pollutant.
The checkbox "End trace at state boundary", simply clips the line at the state boundary.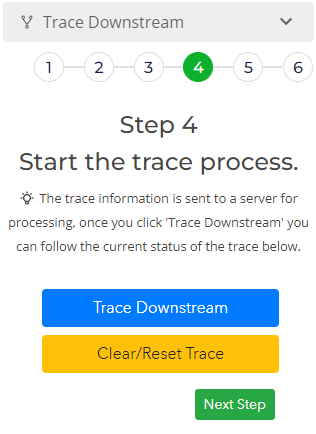
We use a service provided by ESRI that performs the trace which uses a digital elevation model (DEM) to determine the flow direction and path of water, and can take into account factors such as the slope of the terrain, land use, and other physical and environmental characteristics.
Click "Trace Downstream" to begin the process. The current status of your request will appear beneath the buttons.
The checkbox "End trace at state boundary", simply clips the line at the state boundary.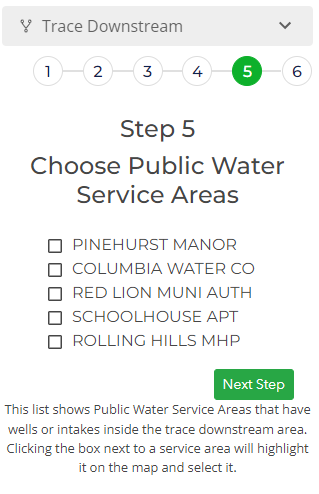
This step "may" show possibly affected Public Water Service Areas. (Areas that were intersected by the buffer zone)
Clicking a box for a service area, will display the area highlighted on the map.
When checked, this area is also searched alongside the buffer to show all affected entities inside the zone.
* Depending on the area you are concerned with, there may not be any Public Water Service Areas.
The checkbox "End trace at state boundary", simply clips the line at the state boundary.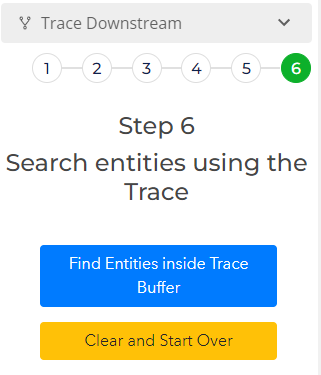
Click the blue "Find Entities inside the Trace Buffer" to find features inside the buffer.
Below you will find a list of possible entities.
If you clicked an optional "Public Water Service Areas", it will find and return entities inside that area as well.
The fields returned are available below.
Entity Types Returned
- Water - PaDWIS Intakes
- Water - PaDWIS Wells
- Public Schools
- Child Care Centers
- Colleges and Universities
- Hospitals
- Hospices
- Drug and Alcohol Treatment Facilities
- Intermediate Care Facilities
- Nursing Homes
- Psychiatric Residential Treatment Facilities
NHD Stream Locator Wizard
The NHD Stream Locator operates as a guided wizard, walking users through the process to locate, identify, review, and submit NHD Streams.
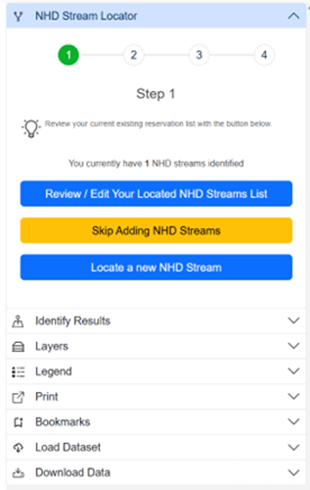
Step 1 – Initialization
Step 1 of the NHD Stream Locator wizard is the initialization step.
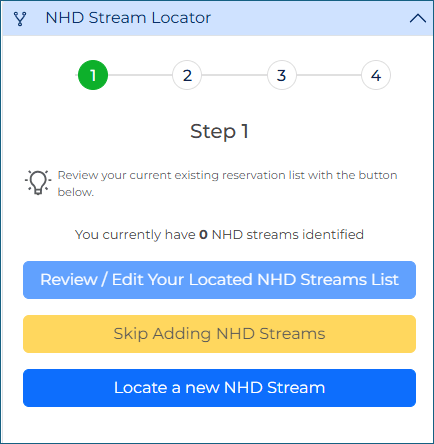
Step 1 is where the user can choose from several options:
- Review / Edit Your Located NHD Streams List – This button will open and/or refresh the “NHD Flowline Results” table below the map where the details of the streams located are displayed for review.
- Skip Adding NHD Streams – This button allows the user to skip straight to step 4.
- Locate a new NHD Stream – This button will send the user to step 2 to start the process of locating a new NHD Stream on the map.
Step 2 – Snapping a Point to NHD Flowline
Step 2 of the NHD Stream Locator wizard is the first step in the process to locate a new NHD Stream. NOTE: When launched from another application (such as ePermitting), the NHD Stream Locator wizard automatically opens to Step 2 and loads the latitude/longitude or GIS point passed to it by the launching application.
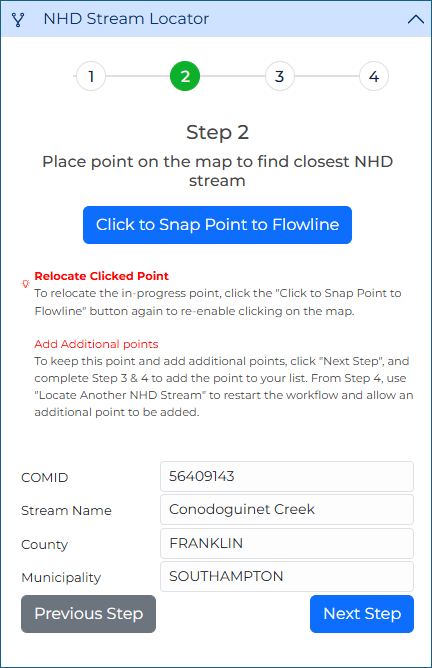
Users must click on the blue “Click to Snap Point to Flowline” button to enable the ability to click on the map to place their EP point.

Once the button has been clicked it will change to a green “Snapping Active” message
When active, the button changes to a green “Snapping Active” indicator.
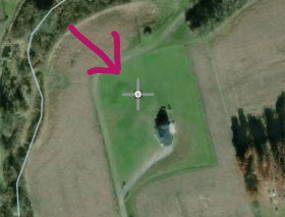
In addition to changing the button to “Snapping Active” the mouse cursor will change to a crosshair with a point when positioned on the map allowing you to click to place the point..
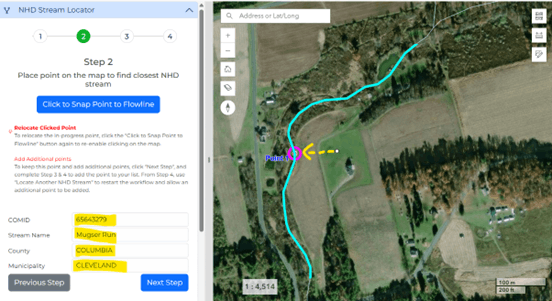
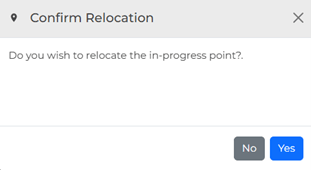
Once the user clicks to place the point, the NHD Locator automatically snaps that point to the nearest NHD Stream, highlights the stream, and pulls data from the stream to populate fields in the NHD Stream Locator wizard… be aware not all streams are named, so sometimes the “Stream Name” field is blank after the point snaps. NOTE: If you accidently clicked in the wrong location, you can re-place the point in a different location by reselecting the “Click to Snap Point to Flowline” button. This will prompt a popup asking to confirm you wish to relocate the in-progress point.
If the point was placed incorrectly, reselect “Click to Snap Point to Flowline”. A confirmation popup will appear asking to relocate the in-progress point.
After the point is correctly snapped, click the “Next Step” button.
Step 3 – Select Stream Side
Step 3 of the NHD Stream Locator wizard is where the streamside is declared. Simply click in the box to open the drop down and select LEFT or RIGHT.
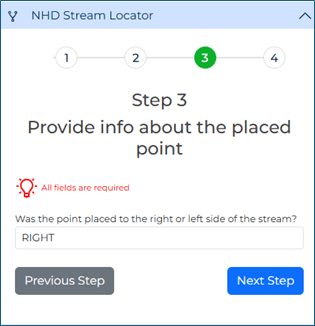
Once you have the selected the proper side, click the “Next Step” button at the bottom of the NHD Stream Locator wizard.
Step 4 – Final Decisions
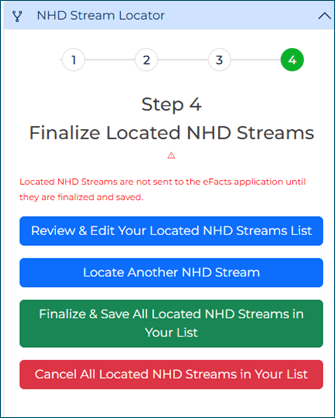
Step 4 of the NHD Stream Locator wizard is the final step; the user can choose from several options:
- Review & Edit Your Located NHD Streams List – This button will open and/or refresh the “NHD Flowline Results” table below the map where the details of the streams located are displayed for review.
- Locate a new NHD Stream – This button will send the user back to step 2 to start the process of locating a new NHD Stream on the map.
- Finalize and Save All Located NHD Streams in Your List – This button will finalize the streams in the “NHD Flowline Results” table below the map, and push it back to eFacts, allowing the user to import the information into their originating application where they launched NHD Locator from
- Cancel All Located NHD Streams in Your List – This button will remove everything in the table below the map and start you back at step 1.
NHD Stream List (NHD Flowline Results Table)
The NHD Stream List refers to the NHD Flowline Results table located below the map. This table lets the user see what points are associated with the location in question both imported from existing snapped point, and those that were snapped during the current NHD Locator session. The table can be accessed and updated via the Review & Edit Your Located NHD Streams List button on NHD Stream Locator wizard steps 1 & 4.

In this table you can perform actions such as:
- Change the stream side (Right / Left) – This is accomplished by
- Delete an entire snapped stream record permanently – This is accomplished by clicking on the trash icon for the desired row (far left side), then when the confirmation message pops up click the “Remove Snapped” button
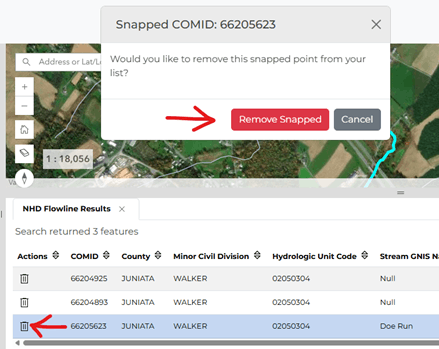
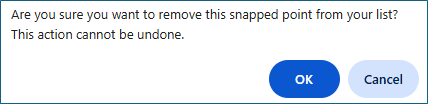
The NHD Locator will request a second confirmation on permanent deletions since the action cannot be undone. If you would like to proceed with the deletion, click the “OK” button.
Caution When Snapping Near PA State Border
Snapping a point outside Pennsylvania is not supported.
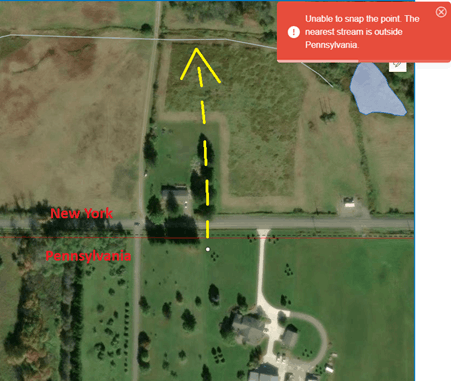
The NHD Stream Locator will always try to find the nearest flowline (straight-line distance) to snap your point. Sometimes that nearest flowline may fall outside of PA when clicking near the border. When this situation happens, the tool will display a message so you know why the point could not be snapped.
Plume Modeling Tool
Plume modeling refers to the process of simulating and predicting the behavior of air pollution plumes. It is a technique used in atmospheric science and environmental engineering to understand the dispersion and movement of pollutants released into the air.
All the tools in this app are presented as wizards: a user interface element that guides users through a complex or multi-step process by breaking it down into a series of smaller, more manageable steps or tasks. The wizards consist of a series of forms, each of which presents the user with a clear and concise set of instructions or questions, and provides feedback on their progress.
The following is an explanation of each step in the process.
The Plume Modeling tool operates based on shapefiles, KMZ or KML files uploaded by the user.
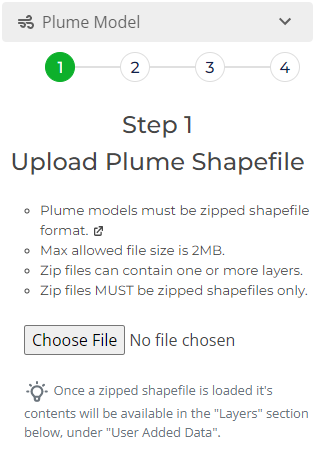
*Plume models themselves are generated by third parties, as it is an intensive process and involves many variables.
Requirements
- Shaoefiles MUST be zipped.
- Polygons and Lines are supported (points are not supported)
- Coordinates should be in WGS84 or Web Mercator
- Max file size is 2 MB
- Files can contain multiple features as some models provide data over time
- GEER ignores links and style formats contained in KML/KMZ files.
Click "Choose File" to locate the file and upload it to the site.
Files are parsed automatically and loaded into the "User Added Data, Plume Models" section of the layers list.
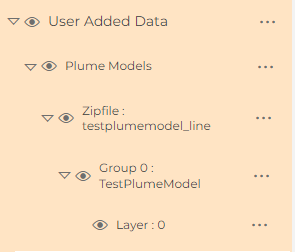 Once the file is parsed you are taken to step 2
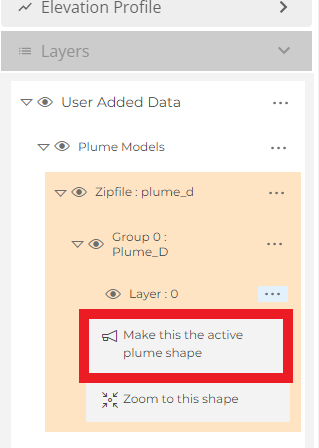
Since this tool allows for multiple shapes for an event, You are required to choose the layer you want to use buy selecting it in the "Layers" sidebar widget.
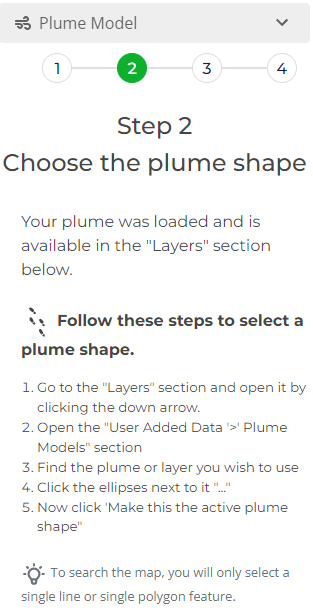
Once the shapefile is parsed and loaded in the "Layers" sidebar, you will need to select it.
You select the one to use by finding it in the layers section, then expanding it by clicking the 3 dot menu. Then click the "button" circled in red as seen in this screenshot.
Now scroll back up to the tool, you will be at Step 3 - seen in the next section
Why a source point? By setting the source of the plume (be it a train derailment, factory incident, fire, etc), we can provide the distance from the source to each entity in the final results.
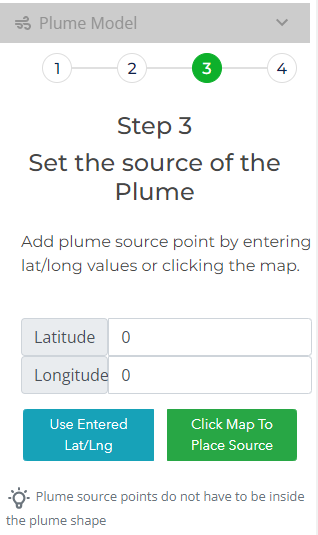
You have two ways to set a source point.
- Enter a latitude and longitude. Enter the coordinates and click "Use Entered Lat/Lng"
- Click the map at the source. Click "Click Map to Place Source", then click the map where the plume originates.
"Find Affected Entities" - finds entities inside the plume shape
Click the blue "Find Affected Entities" button to find entities inside the buffer. Your results will appear in a table below the map.
Below you will find a list of possible entities.
The fields returned are available below.
The following tools are available in the search results table
Filter and sort : You can filter columns using text or sort the column
Export data to CSV : Export the current table to a csv file.
Field Chooser : Turn fields on and off
Entity Types Returned for Plumes
- Public Schools
- Child Care Centers
- Colleges and Universities
- Hospitals
- Hospices
- Drug and Alcohol Treatment Facilities
- Intermediate Care Facilities
- Nursing Homes
- Psychiatric Residential Treatment Facilities
Data Fields for entities.
Contact information comes from DEP or the Pa Department of Health- Latitude
- Longitude
- Source Layer
- Distance from Source (feet)
- Distance from Source (miles)
- Phone number
- System Name
- Contact Person
- Habitat (sensitive or endangered species information)
- Species
Nuclear Power Plant Incident Tool
The Nuclear incident tool is very similar to the Plume modeling in that it refers to the process of simulating and predicting the behavior of air pollution plumes. It is a technique used in atmospheric science and environmental engineering to understand the dispersion and movement of pollutants released into the air.
All the tools in this app are presented as wizards: a user interface element that guides users through a complex or multi-step process by breaking it down into a series of smaller, more manageable steps or tasks. The wizards consist of a series of forms, each of which presents the user with a clear and concise set of instructions or questions, and provides feedback on their progress.
The following is an explanation of each step in the process.
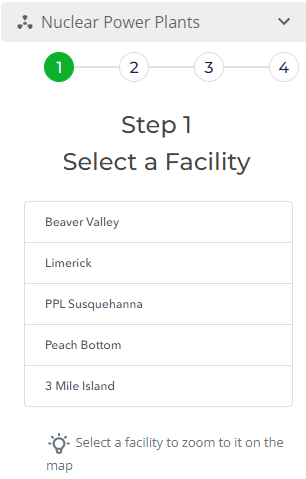
Click on the Facility to zoom to it, the map will automatically enable the related layers
The "from" bearing refers to the bearing direction the wind is coming FROM
This step is entirely OPTIONAL, but seeing the wind direction on the map can be helpful.
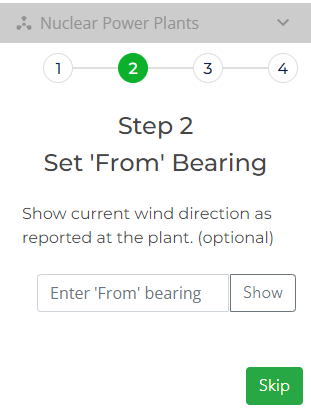
The bearing "from" direction as reported at the plant.
This bearing is provided in the report received from the plant.
This will show the wind direction on the map in the form of an arrow
The arrow displayed on the map shows the direction the wind is blowing.
In this step we are selecting zones downwind of the plant where we expect pollutants to drift.
In this screenshot, notice the arrow underneath the "E" section pointing east, using the checkboxes we've selected the 5 & 10 miles zones in the direction the wind is expected to be moving.
This prepares you for step 4, where you will search for entities inside the selected areas.
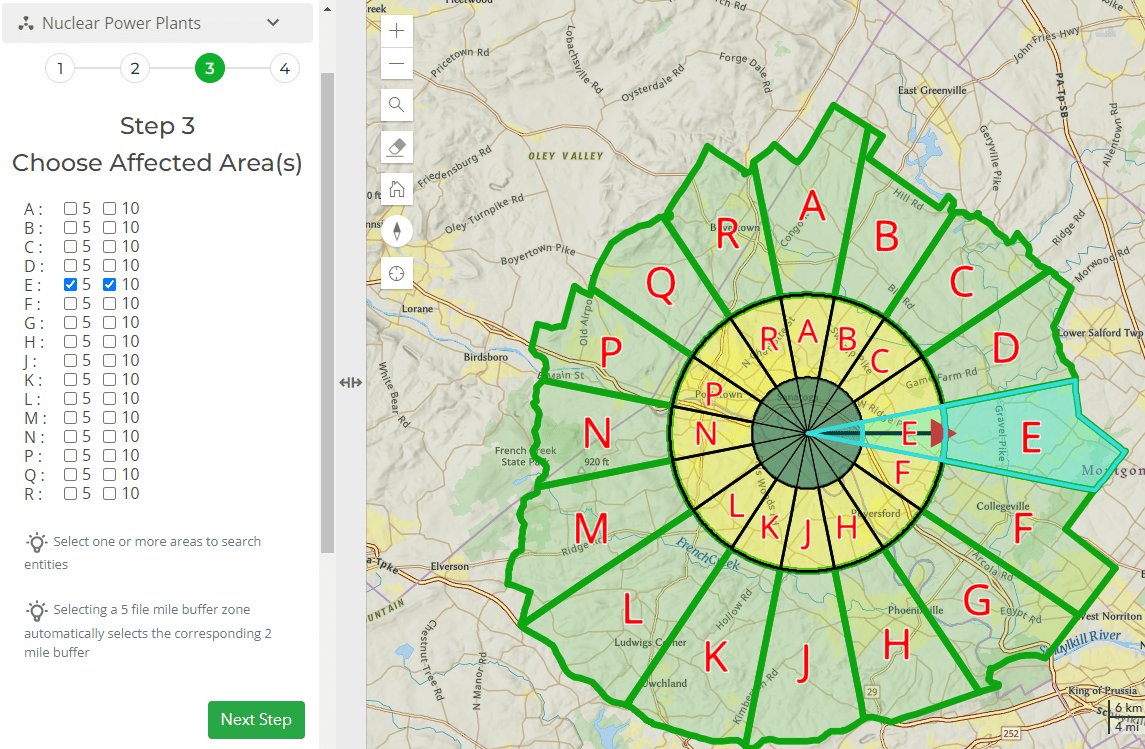
Here we are selecting zones around the plant where we wish to find affected entities that would be affected by a release.
5 - refers to the 5 miles zones (yellow areas)
10 - refers to the 10 miles zones (green areas)
Selecting a 5 mile zone automatically selects the 2 mile zone for the same area"Find Affected Entities" - finds entities inside the selected zones.
Following along from step 3, we would be searching all 3 "E' zones we've selected.
When you click the "Find Affected Entities" button, the application will display any entities inside these blue highlighted areas below the map.
Click the blue "Find Affected Entities" button to find entities inside the buffer. Your results will appear in a table below the map.
Below you will find a list of possible entities.
The fields returned are available below.
The following tools are available in the search results table
Filter and sort : You can filter columns using text or sort the column
Export data to CSV : Export the current table to a csv file.
Field Chooser : Turn fields on and off
Entity Types Returned for Nuclear Power Plants
- Public Schools
- Child Care Centers
- Colleges and Universities
- Hospitals
- Hospices
- Drug and Alcohol Treatment Facilities
- Intermediate Care Facilities
- Nursing Homes
- Psychiatric Residential Treatment Facilities
Data Fields for entities.
Contact information comes from DEP or the Pa Department of Health- Latitude
- Longitude
- Source Layer
- Distance from Source (feet)
- Distance from Source (miles)
- Phone number
- System Name
- Contact Person
- Habitat (sensitive or endangered species information)
- Species
Offline Data
We have implemented offline data functionality in the application for some datasets. Due to the large number of layers and the overall size of DEP eMapPa data, it is not possible to make all of it available offline. However, we are now providing offline access for the specific datasets that are critical to the application, allowing you to continue reporting on these entities even without an internet connection.
- PaDWIS Intakes
- PaDWIS Wells
- Public Water Service Supply Areas
- Safe Drinking Water Areas
How does it work?
To access offline data, simply log in to the application while the eMapPa services are online. The data will be downloaded automatically in the background, allowing you to continue using the application as usual during the process.
What happens if I try to access data when eMapPa services are offline?
The application verifies service availability by “pinging” the server. If the server fails to respond, it will automatically switch to loading the data stored in your browser.
Accessing other eMapPa layers when services are down
Non-critical layers will not be stored offline and will be hidden from the “Layers” section in the sidebar. You may notice a reduced set of groups and layers as a result. However, layers from other agencies (ESRI, NOAA, PASDA, etc.) will still appear in the sidebar as they normally do.
You can still use the Plume Modeling, Trace Downstream, and Nuclear Facilities tools when the DEP GIS servers are unavailable—whether due to downtime or maintenance. However, there are a few important things to note:
- Offline data is stored in your browser’s database, not its cache. Clearing the cache will not delete it.
- Offline data is tied to the browser it was downloaded in. For example, data downloaded in Chrome won’t be available in Edge. Log in with the browser you plan to use for offline access.
- The offline data is not synced to other devices. Offline data does not sync across devices. Each browser maintains its own unique database copy.
- Offline data is tied to your user account, device, and browser. Logging in under a different Windows account will require re-downloading the data.
- Externally sourced data or map services (e.g., PASDA, ESRI, NOAA) are not stored for offline use.
- This has not been tested using any Apple browsers or devices.
Searches
Bureau of Recreation and Conservation aka BRC - Grant Funding Chart
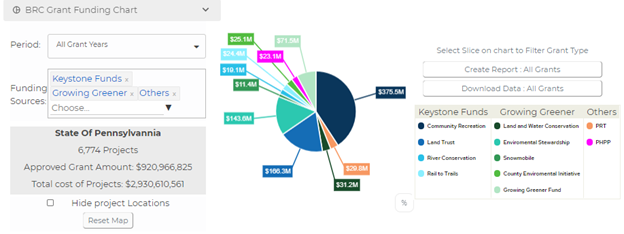
The BRC Grant Funding Chart widget provides a visually intuitive representation of project funding amounts across various funding sources. This interactive pie chart ensures easy comprehension of funding distribution. Users have the flexibility to extract project details in both PDF and CSV formats. Furthermore, they can apply filters based on grant year, funding source, project county, and more. The integrated map dynamically reflects funded projects with corresponding symbology aligned with the pie chart. A clear symbology key is presented in the chart legend beneath the pie chart for seamless interpretation.
To use the BRC Grant Funding Chart widget:- Click the BRC Grant Funding Chart widget in the sidebar
- FTo enhance project selection, the BRC Grant Funding Chart widget offers a comprehensive filtering system. By default, the widget loads projects spanning all grant years and funding sources. It generates the pie chart according to project costs and funding sources, simultaneously plotting project locations on the map. Users have the freedom to determine their filters: they can choose to filter by grant year, funding source, or both in combination. This empowers users to tailor their view to specific criteria, optimizing their insights and analysis.
-
1. Filter by Grant Year: Users have the option to select a specific grant year using the "Period" dropdown list. This dropdown list restricts the selection to a single option, allowing users to focus their analysis on a particular grant year of interest.By utilizing this feature, a summary, chart, and map will be generated to showcase grant projects exclusively linked to the chosen time frame. This facilitates a targeted and detailed exploration of projects for the selected grant year.
-
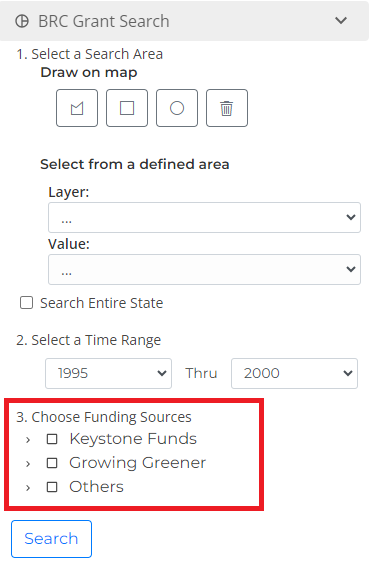
Filter by Funding Source: Users possess the capability to determine the funding sources they wish to visualize. This can be achieved through the use of funding source checkboxes, enabling multiple selections. This empowers users to focus on specific funding sources of interest, facilitating a nuanced analysis of project distribution.Upon implementing this filter, a summary, chart, and map will be generated to exhibit grant projects exclusively tied to the chosen funding sources. This approach enables users to gain insights into projects aligned specifically with the selected funding types, enhancing their understanding of the distribution and impact of different funding sources.
-
Filter by County: Users have the capability to filter projects based on specific counties. This can be easily accomplished by clicking on the map within a county boundary. A clear indication of a successful county filter is provided when the summary displays the name of the selected county instead of "State of Pennsylvania." This functionality streamlines the process of examining projects within a particular geographic area, enabling users to refine their analysis to a county level.Users are provided with the option to reset their county selections on the map by utilizing the "Reset Map" button. This feature ensures that users can easily undo their county filters and revert to the default view, enhancing the overall usability and flexibility of the filtering system.
- Additional functions within the widget include:
-
Users are granted the ability to conceal the display of projects on maps. This can be accomplished by selecting the "Hide Project Locations" checkbox. This feature provides users with the flexibility to temporarily remove project locations from the map view, allowing them to focus on other aspects of analysis without the visual clutter of project markers.
-
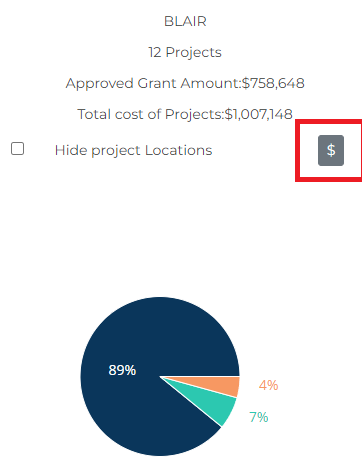
Users are presented with the option to select the representation mode of the pie chart in either dollars ($) or total percentage (%). This choice can be made by using the selector button located at the top right corner of the chart. By adjusting this setting, users can customize their viewing experience to best suit their analytical needs, enabling them to comprehend funding distribution in a format that aligns with their preferences.
-
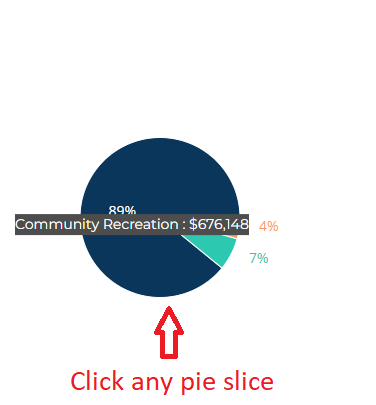
A seamless interaction between the pie chart and the map is enabled through the "Filter map via pie chart" feature. By clicking on a specific slice of the pie chart, users can instantly filter the map to display only the projects associated with that particular funding source or category. To revert the map to its original view, users can simply select the "Show All Grants" button, triggering a reset of the map's display. This integrated functionality enhances user exploration and analysis, promoting a dynamic understanding of the data presented.
-
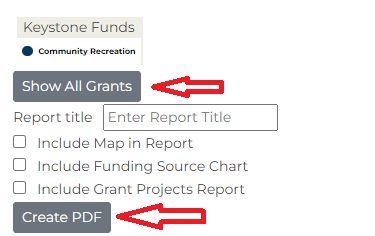
The capability to generate reports in PDF format is provided to users through the "Create PDF" button. When no specific pie chart slices are selected, the generated report encompasses all project types. However, if a user chooses a particular pie chart slice, the report will be generated exclusively for that selected project type. This approach offers a tailored and focused report that aligns with the user's analysis. To return to the original view, users can select the "Show All Grants" button, effectively resetting the report generation. This feature empowers users to generate insightful and targeted reports based on their analysis requirements.
Projects Mapped By District
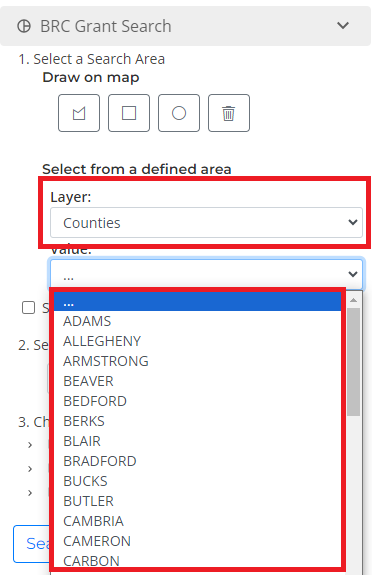
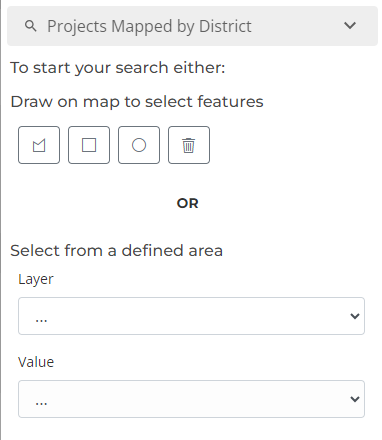
The District Search for Mapped Projects allows you to explore mapped projects within a specific area. This can be done either by defining a custom area or by choosing from predefined options available in a dropdown menu (such as County, Regional Offices, HUC Watersheds, and Conservation Landscapes). The search results are presented in a Results Table, providing a clear overview of the projects associated with the chosen geographical region.
-
Define Area: Users have the ability to specify a search area of their preference directly on the map using the provided drawing tools. This feature empowers users to precisely outline the geographic region they wish to explore, enhancing the accuracy and granularity of their search results.
-
Predefined Area: Users have the option to choose from predefined search areas using two dropdown selectors: Layer (which includes options like County, Regional Office, etc.) and Value (which includes specific choices such as Adams County, Regional Office 2, etc.). This streamlined approach facilitates the selection of a desired geographic region for exploring mapped projects.
Searches
Park Amenity Search
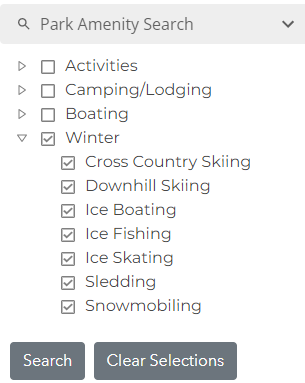

The Park Amenity Search enables users to search for user specified activities and amenities within Pennsylvania State Parks. NOTE: the outer level checkbox selects ALL sublevel checkboxes.
- Must offer all selected Amenities - The park must provide every amenity you have selected.
- Must offer at least one of the selected Amenities - The park must provide at least one of the amenities you have selected.
- Results are populated in the Results Table. Each record in the Results Table is selectable to zoom to the selected feature.
Park ADA Amenity Search
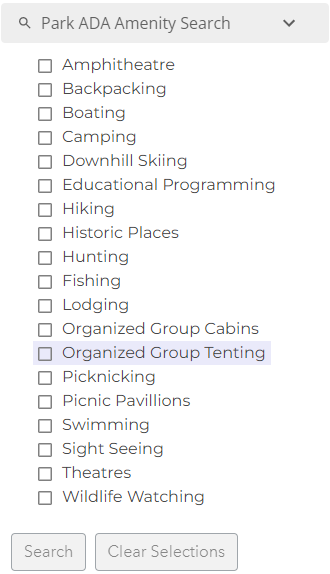
The Park ADA Amenity Search enables users to search for user specified activities and amenities that meet ADA requirements within Pennsylvania State Parks.
- Must offer all selected Amenities - The park must provide every amenity you have selected.
- Must offer at least one of the selected Amenities - The park must provide at least one of the amenities you have selected.
- Results are populated in the Results Table. Each record in the Results Table is selectable to zoom to the selected feature.
Forest Search
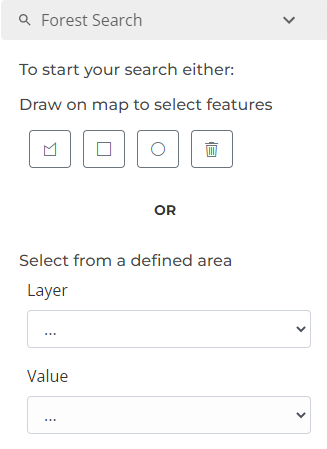
The Forest Search enables users to search for Pennsylvania State Forests & individual assets within the commonwealth via a user defined area, or allows the user to find a specific asset by selecting a predefined asset from dropdowns. Results are displayed in the Results Table.
To perform a state forest asset search, follow one of the following methods:
-
Define the area where you would like to search for PA State Forests: users can define a search area of their choice on the map using given draw tools.
-
Predefined: users can select a predefined PA State Forest Assets via the two drop down selectors: Layer (State Forests, District Offices, etc) & Value (Tuscarora, Elk, etc.). NOTE: Searching by county here will find all state forests within the selected county.
-
Results are populated in the Results Table. Each record in the Results Table is selectable to zoom to and view the extent of the selected feature.
Forest ADA Amenity Search
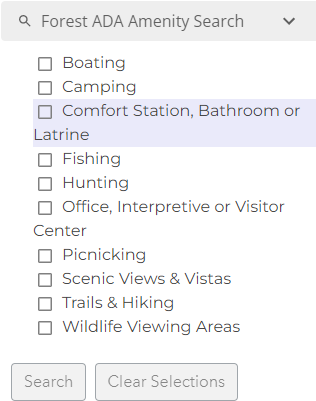
The Forest ADA Amenity Search enables users to search for user specified activities and amenities that meet ADA requirements within Pennsylvania State Forests.
- Must offer all selected Amenities - The park must provide every amenity you have selected.
- Must offer at least one of the selected Amenities - The park must provide at least one of the amenities you have selected.
- Results are populated in the Results Table. Each record in the Results Table is selectable to zoom to the selected feature.
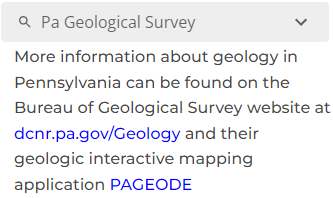
PA Geologic Survey Information
The PA Geologic Survey Info section guides users to the PA Geological Survey's web application PAGEODE.
Searches
Search Streams by Area
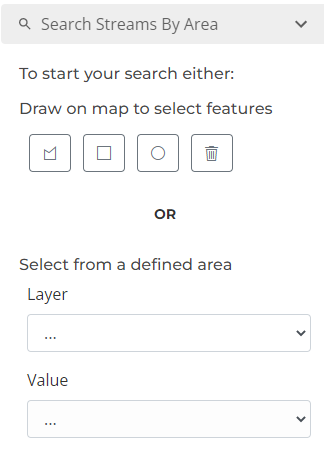
The Search Streams by Area tool enables users to search for public streambeds via a user defined area, or by selecting a predefined area from dropdowns. Results are displayed in the Results Table.
-
Define Area: users can define a search area of their choice on the map using given draw tools.
-
Predefined Area: users can select a predefined search area via the two drop down selectors: Layer (County, HUC watershed) & Value (Adams County, Tuscarora Watershed, etc.).
Search Streams by Text
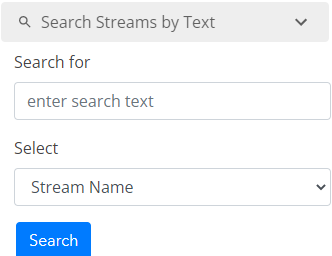
The Search Stream By Text enables users to search for public streambeds across the entire state PA via a free response text field (i.e. users can search for "Creek" to find all public streambeds in PA with the word Creek in their name) Results are displayed in the Results Table.
Searches
Antler Restrictions
The Antler Restrictions widget displays Antler Restriction Rules.
To use the Antler Restrictions widget:- Click the Antler Restrictions widget
-
Doing so will generate a summary and show Antler Restriction Rules in Table.
Summary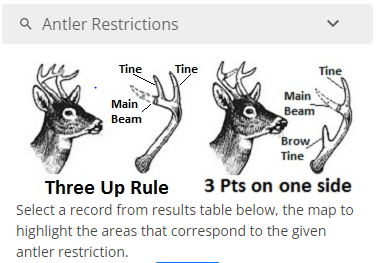
Antler Restriction Rules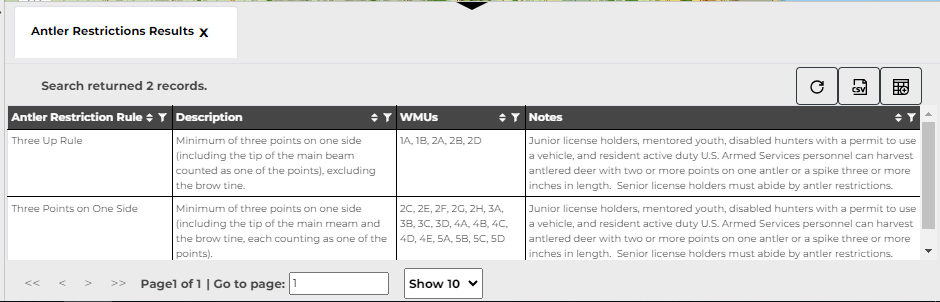
-
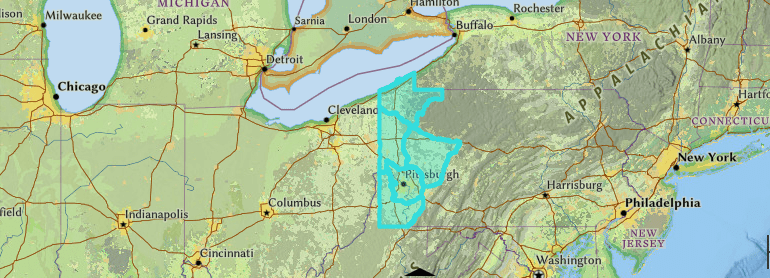
On click of row in Table, it will highlight and zoom to Wildlife Management Units's.
Hunting Hours
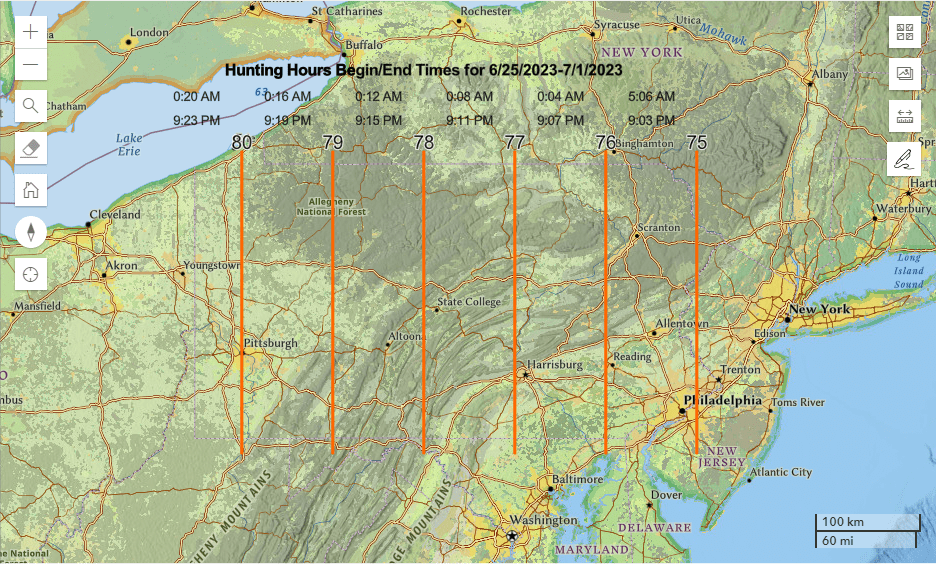
The Hunting Hours widget depicts legal hunting hours for small and big games.
To use the Hunting Hours widget:- Click the Hunting Hours widget
- Select the date for which want to get Hunting Hours
- Click on Get Hunting Hours
-
Doing so will show Hunting Hours on Map .
Deer Harvest Statistics
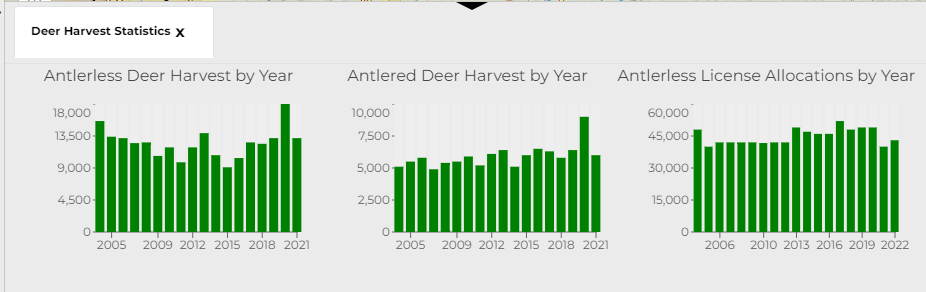
The Deer Harvest Statistics widget shows Statistics in three bar charts Antlerless Deer Harvest by Year, Antlered Deer Harvest by Year and Antlerless License Allocations by Year for the selected WMU.
To use the Deer Harvest Statistics widget:- Click the Deer Harvest Statistics widget
- Select the WMU for which want to get Deer Harvest Statistics
-
Doing so will show Deer Harvest Statistics .
Seasons & Bag Limits
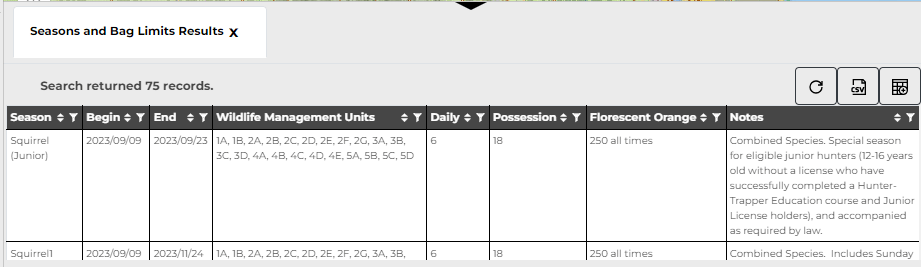
The Seasons & Bag Limits widget shows Limits in Table.
To use the Seasons & Bag Limits widget:- Click the Seasons & Bag Limits widget
-
Select Species, Season Type and check/uncheck today's Filter
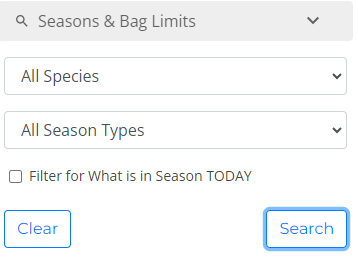
- Click on Search
-
Doing so will show Limits in Table.
-
On click of row in Table, it will highlight and zoom to Wildlife Management Units's.
Searches
Check Proposed Location Search
The Check Proposed Location Search allows users to enter a coordinate pair (latitude and longitude) of the proposed site of telecommunications infrastructure and search to see if it is located within a mapped prohibited or avoidance area.

The Check Proposed Location Search also has functionality that allows users to select multiple formats for the coordinate pair entered.

Water Supply Service Areas Editor
The Water Supply Service Areas Editor allows users to create a new service area or update an existing service area.
This tool is presented as a wizard: a user interface element that guides users through a complex or multi-step process by breaking it down into a series of smaller, more manageable steps or tasks. The wizard consists of a series of forms, each of which presents the user with a clear and concise set of instructions or questions, and provides feedback on their progress.
The following sections explain each step in more detail.
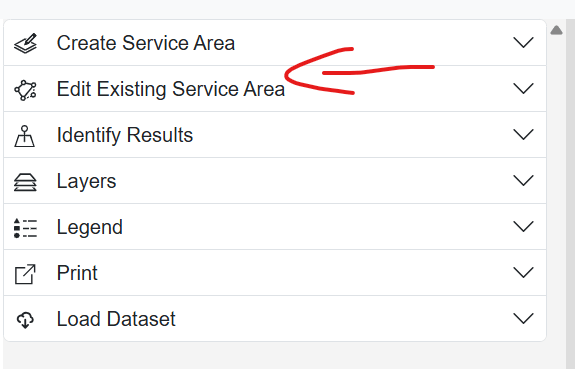
On the sidebar, you will see two tools: Create Service Area and Edit Existing Service Area.
- Create Service Area takes you through creating and submitting a brand new service area.
- Edit Existing Service Area takes you through selecting an existing service area polygon and then editing and adjusting it as needed.
- Both workflows share similar functionality, which is explained in the steps below.
After you choose a workflow, this step looks a little different depending on whether you are creating a new service area or editing an existing one. Both workflows use the same general geometry tools, but the starting point is different.
Create Service Area geometry
If you selected Create Service Area, this step is where you create the new service area boundary. You can either import a zipped shapefile or draw the service area directly on the map.
The first box in this step is the Import Shapefile section. A question mark appears to the right of the section title and provides more details when you hover over it.
- The shapefile must be uploaded as a .zip file.
- The zip file must include .shp, .shx, .dbf, and .prj files.
- Click Choose File to browse to the zip file on your computer, then select it and click Open.
- If the import is successful, the wizard loads the shapefile and zooms to its location on the map.
- After import, you should see the polygon vertices and continue with the later steps of the wizard.
To draw the service area instead, use the polygon sketch tool in the toolbar at the bottom of the geometry section. Click on the map to add vertices, double-click to finish the polygon, and then click outside the polygon to complete the edit. Once the geometry is complete, the wizard will allow you to continue to the next step.
Edit Existing Service Area geometry
If you selected Edit Existing Service Area, you must first choose the existing service area you want to edit. Click Select Service Area on Map, then click the service area polygon on the map. After the service area loads, it moves into the geometry step where you can adjust or replace its boundary.
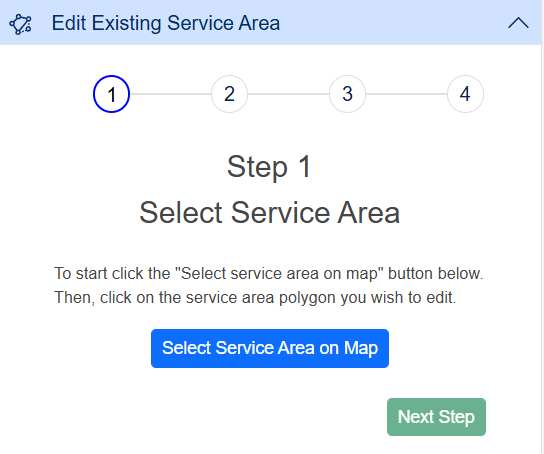
The edit geometry step includes the same Import Shapefile functionality used by Create Service Area. For edit, importing a shapefile replaces the selected service area's geometry with the uploaded polygon geometry. The shapefile follows the same upload instructions and file requirements listed above.
You can also edit the selected service area directly in the map tool. After the service area loads, the polygon vertices appear on the map and the tool displays on-screen instructions for the current edit action.
- Orange circles are existing vertices. Drag them to reshape or adjust the service area boundary.
- White circles appear between existing vertices. Click a white circle to add a new vertex at that location.
- When you are finished adjusting the polygon, click outside the polygon to complete editing and continue to the next step.
Geometry toolbar settings
Both Create Service Area and Edit Existing Service Area include the same geometry toolbar settings. On the right side of the toolbar, click the gear icon to open options for tooltips, snapping, and the grid.
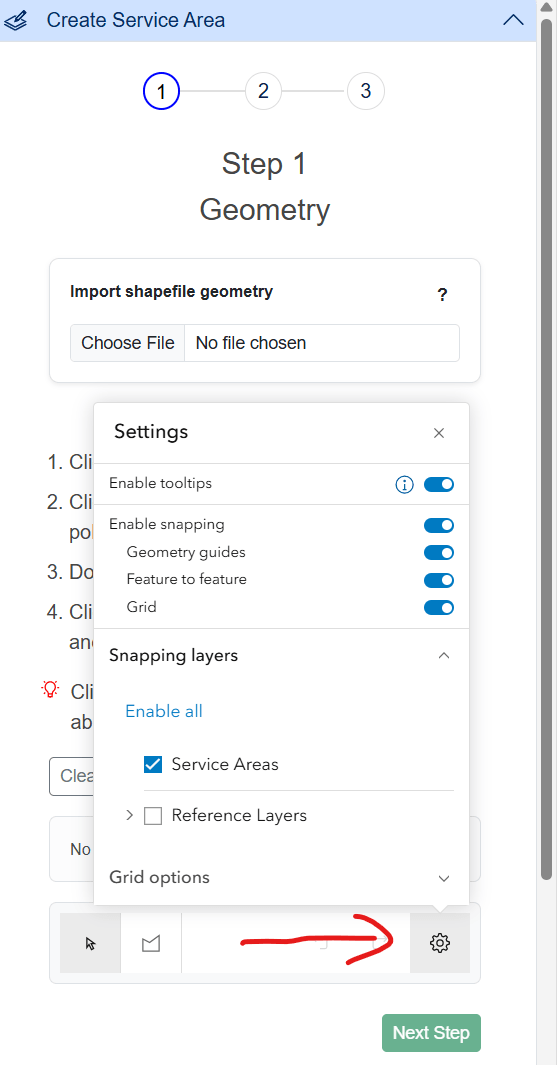
- Tooltips: shows a small window while you click and edit the polygon with information about the deflection angle, segment distance, and polygon area.
- Snapping: is turned on by default, but you still need to choose at least one snapping layer in the snapping layers section if snapping is not working during your edit. Snapping helps you align vertices with another service area.
- Grid: adds a box grid overlay to the map. When the grid is enabled, the grid options section also becomes available so you can change settings such as placement and angle.
Note: While the geometry step is active, map clicks are reserved for drawing or editing so the map does not switch back into normal identify behavior. While sketching or editing, you will see a status box above the toolbar that tells you when geometry work is in progress and when the geometry is complete and ready for the next step.
Clear Sketch
The Clear Sketch button removes the current sketch from the map and clears the geometry you are working on. Use this when you want to discard the current drawing, imported shapefile, or in-progress geometry edits and start again.
- Create Service Area: Clear Sketch removes the new service area geometry and resets the create workflow back to the beginning. You will need to draw a new polygon or import a shapefile again before continuing.
- Edit Existing Service Area: Clear Sketch removes the loaded service area from the sketch tool and clears any geometry edits you made during the current edit session. You will need to select the existing service area from the map again before continuing.
Note: Clear Sketch only clears the current in-progress sketch session. It does not save changes, and it does not delete an existing service area from the database.
Cut Area
The Cut Area tool is available when editing an existing service area. Use this tool when you need to remove a portion of the selected service area boundary.
Before using Cut Area, first select an existing service area and finish any active geometry edits. The tool is available once the sidebar shows that the geometry is ready.
- Click Cut Area to start drawing the area you want to remove from the selected service area.
- Click on the map to draw a polygon around the portion of the service area that should be removed.
- Double-click to finish drawing the cut polygon.
- The part of the selected service area that overlaps your cut polygon will be removed from the working sketch.
- After the cut is applied, review the updated boundary before continuing to the overlap check step.
The example below shows the same service area before, during, and after using Cut Area.
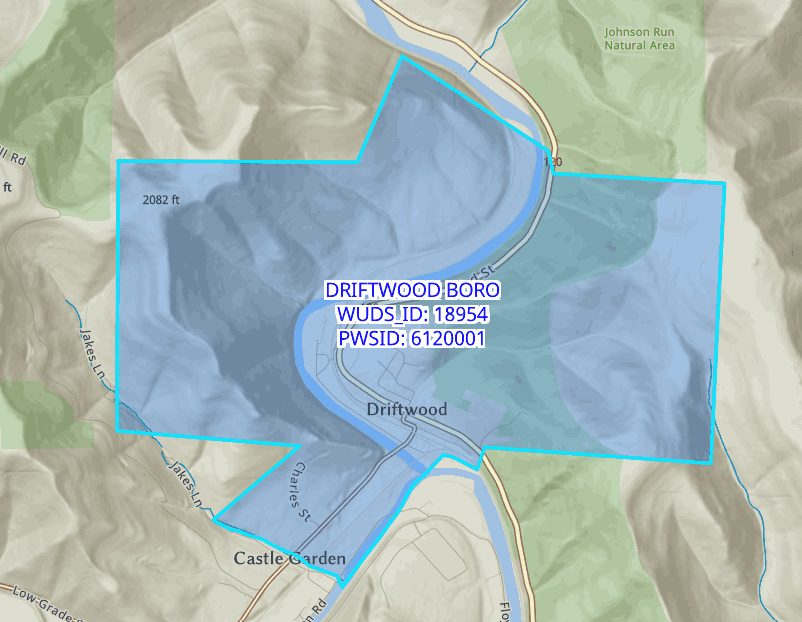
Before: The selected service area is loaded and ready to edit.
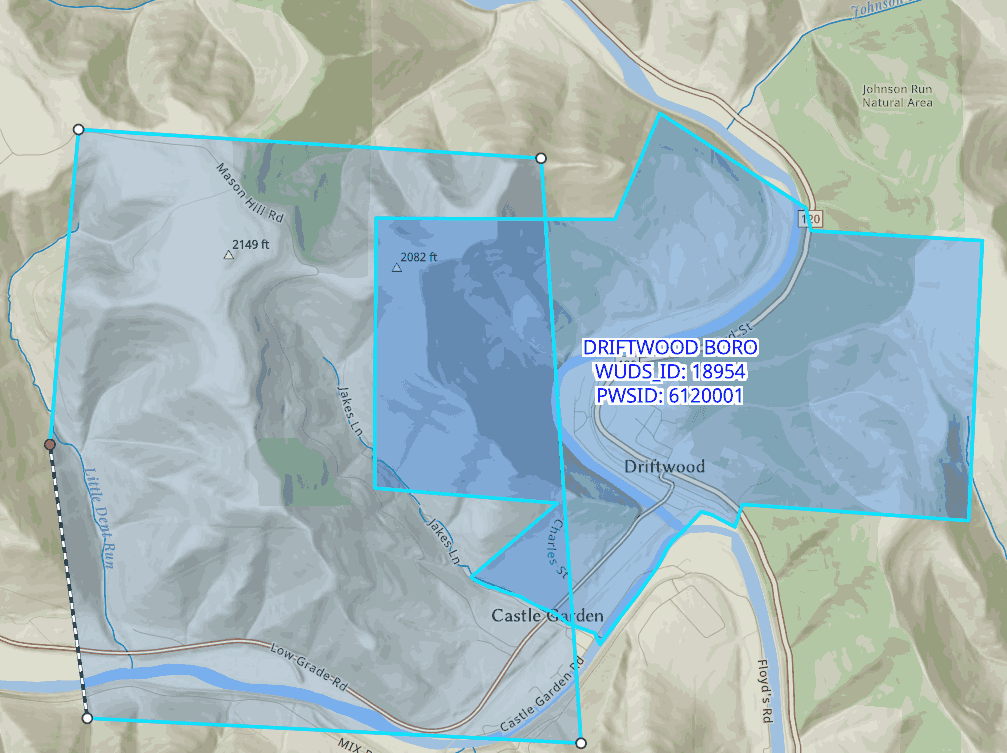
During: A cut polygon is drawn over the area that should be removed.
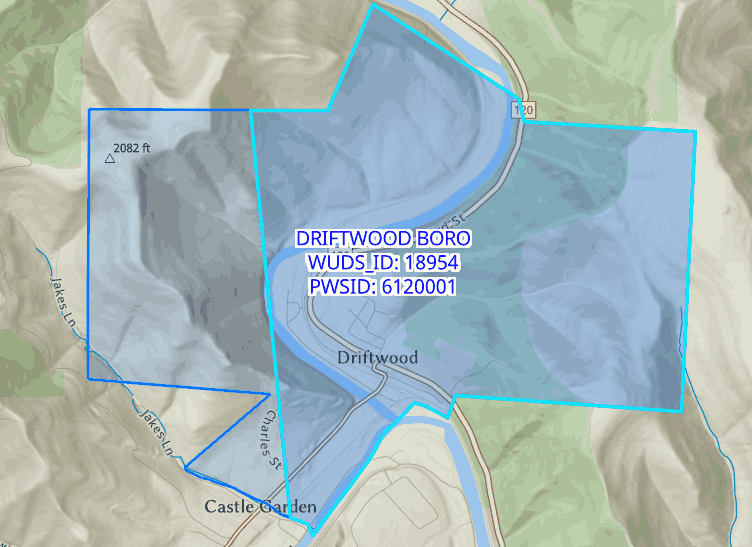
After: The overlapping portion is removed from the working sketch.
Note: Cut Area only changes the in-progress sketch. The change is not saved to the database until you complete the later steps and click the final save button.
Tip: If the Cut Area button is disabled, finish the current geometry edit first by clicking outside the polygon. When the sidebar shows Geometry ready. You may continue to the next step., you can use Cut Area or move forward.
Warning: If the cut polygon does not overlap the selected service area, nothing will be removed. If the cut would remove the entire service area, the tool will stop the cut and you will need to draw a smaller cut area.
Trace Boundary
The Trace Boundary tool helps align your current service area sketch with the boundary of an existing service area. Use this tool when part of your new or edited service area should follow an existing service area.
Trace Boundary works by checking the sketch for overlap with existing service areas. If the sketch overlaps one or more existing service areas, the tool uses those existing boundaries to align your sketch. The result is a cleaner boundary that follows the existing service area edge.
- Draw, import, or edit your service area so that it overlaps the existing service area boundary you want to follow.
- Finish the active geometry edit by clicking outside the polygon.
- Click Trace Boundary.
- The tool checks for overlapping existing service areas and removes the overlapping portion from your working sketch.
- Review the updated sketch to make sure the boundary now follows the existing service area as expected.
In the example below, the new service area extends farther south, but part of it overlaps Driftwood Boro. Trace Boundary is used so the new service area follows the more detailed Driftwood Boro boundary.
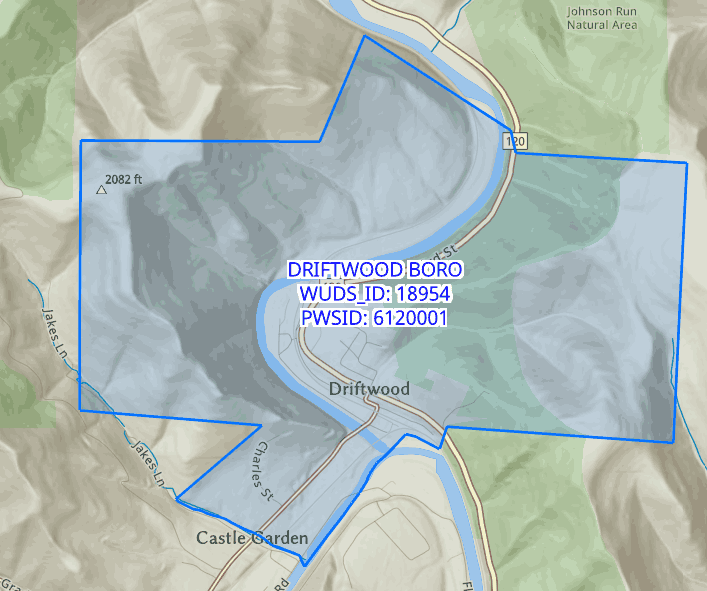
Before: The working sketch overlaps the existing service area boundary that should be traced.
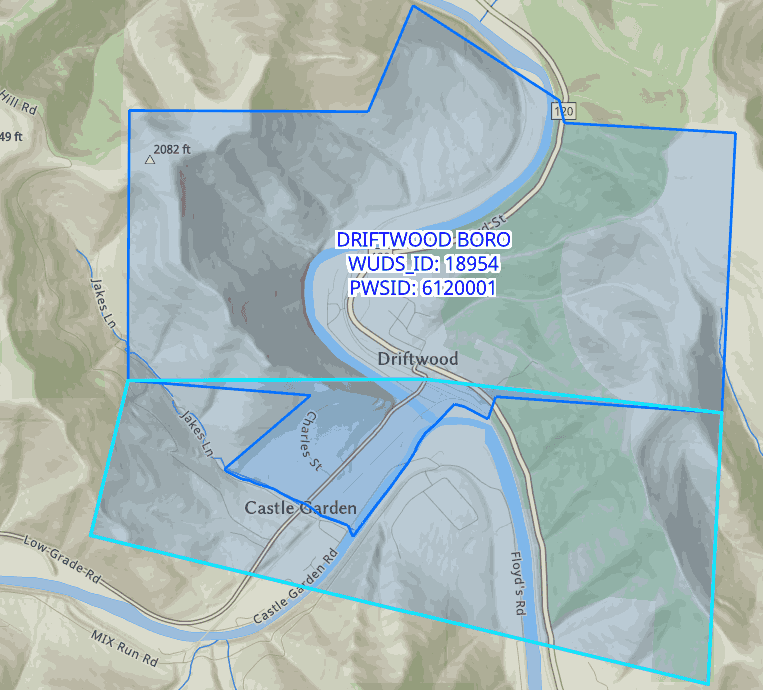
During: The sketch is intentionally overlapped with the existing service area so the shared boundary can be used.
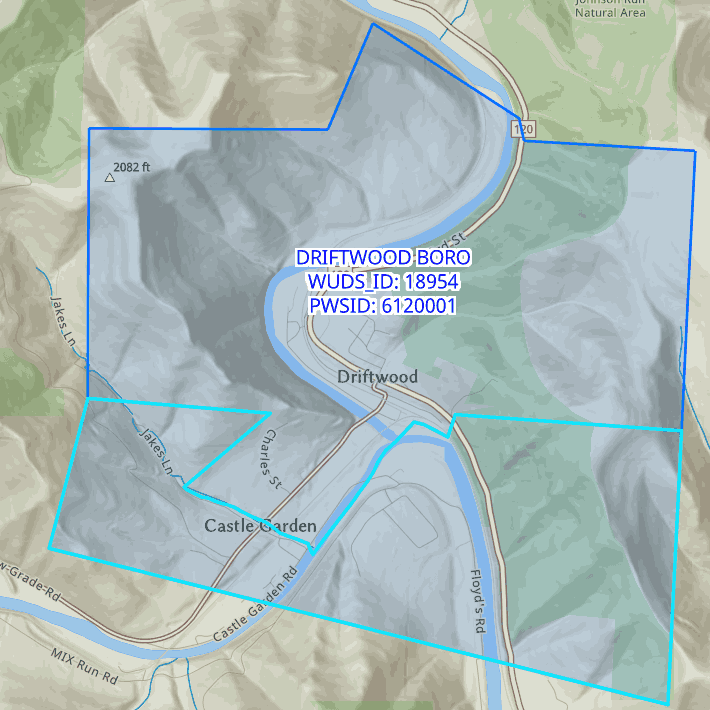
After: The overlapping portion is removed and the sketch now follows the existing boundary.
Note: Trace Boundary only changes the in-progress sketch. The change is not saved to the database until you complete the later steps and click the final save button.
Tip: Trace Boundary works best when your sketch overlaps the existing service area boundary you want to follow. If the sketch does not overlap an existing service area then there is nothing for the tool to trace.
Warning: If the trace would remove the entire sketch, the tool will stop the trace. In that case, adjust the sketch so less of it overlaps the existing service area, then try Trace Boundary again.
You cannot move to the next step until the geometry is complete and the wizard reports that it is ready.
This step checks to see if the current polygon overlaps with any existing ones.
- If no overlap is found, the wizard will report that the polygon is clear and you may continue.
- If any overlap is found, the wizard will report how many existing service areas were overlapped against the sketch.
- You can continue to the next step and submit the edits but the overlap will remain.
- There will also be information on how to use the Trace Boundary tool or to go back to the previous step and edit the polygon manually.
- See instructions for Trace Boundary in #2 Create or edit a service area geometry.
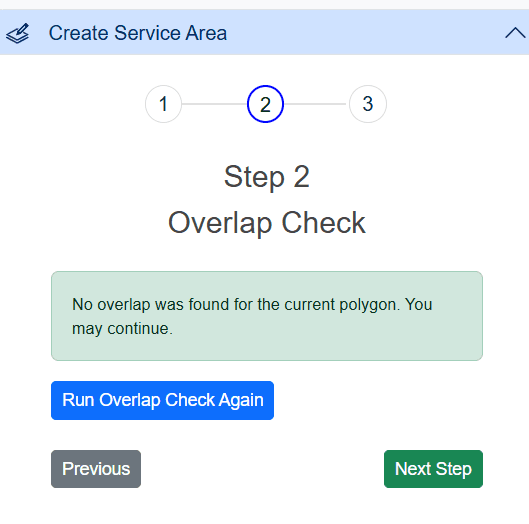
No Overlap
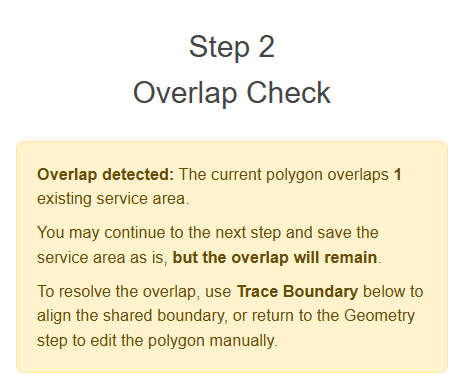
Overlap Detected
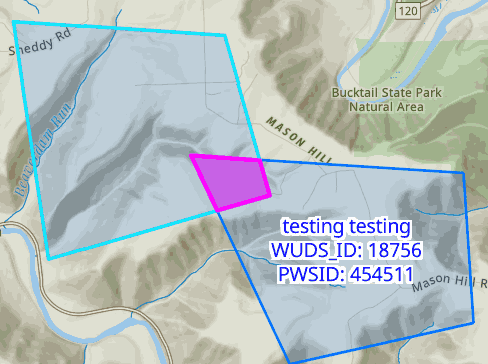
When an overlap is detected, the contact info (email and phone number) of the service areas are displayed. Also, the part of your sketch polygon that is overlapping will be highlighted in magenta for easy spotting.
If you wish to correct the overlap, you can either utilize the the Trace Boundary tool or return to the geometry step, adjust the polygon, and then run the overlap check again.
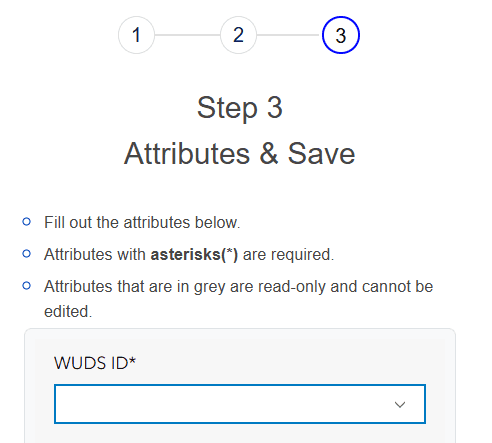
The final step is where you add or update the attributes for the service area you are working on before saving.
- If you are updating an existing feature, the current attribute values are loaded into the form so they can be reviewed and corrected if needed.
- If you are creating a new service area, this step is where the required attribute information is entered before the new feature is saved.
Several fields are required. Required fields are marked with an asterisk (*) on the form. Fields that are in grey are read-only and cannot be edited.
- The required fields include WUDS ID, Public Water Supply Name, Contact First Name, Contact Last Name, Email, Phone, Address 1, City, State Code, Zip Code, and PWSID.
- The Email and Phone fields have specific validation requirements:
- Email must contain text before and after a single @ symbol and must include a period in the domain portion.
- Phone must contain digits only and must be 10 digits long.
- If the email address or phone number is filled in but invalid, the save will be blocked until the format is corrected.
When you click the save button (Create Service Area / Save Updated Service Area), the create workflow adds a new service area feature and the update workflow saves the edited geometry and attribute changes back to the selected existing feature.
After a successful save, the wizard resets to Step 1 so you can begin a new create or edit session.
Settings and Tools
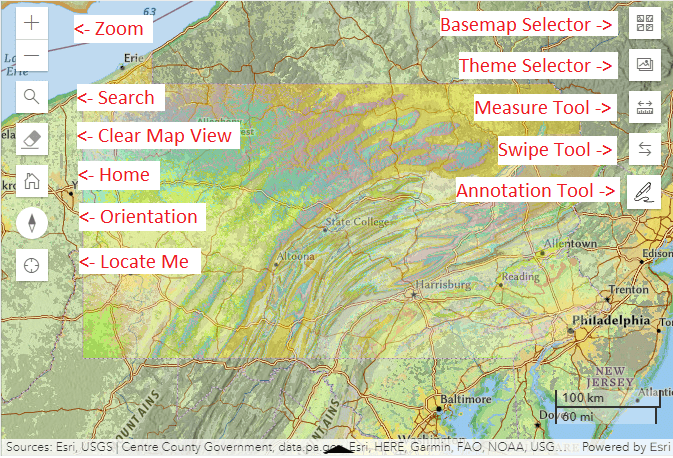
The navigation controls for this application are located directly on the main map component as shown in the image below.
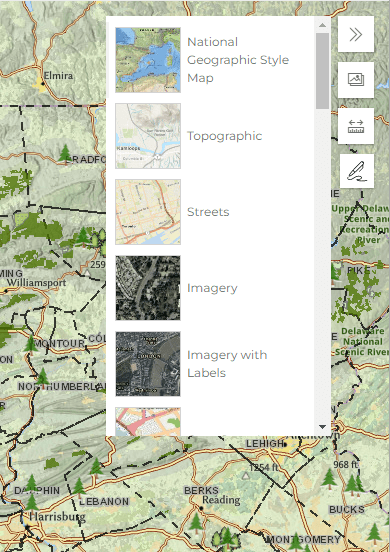
Basemaps
The Basemaps widget  presents a gallery
of basemaps, any one
of which can be used
as a background
image on the map
component. Simply
left-click on the
basemap you wish to
display.
presents a gallery
of basemaps, any one
of which can be used
as a background
image on the map
component. Simply
left-click on the
basemap you wish to
display.
Map Themes
The Map Themes tool  presents a gallery of layer and basemap combinations for quick display of related information.
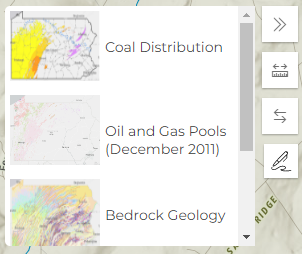
- Coal Distribution
- Oil and Gas Pools
- Bedrock Geology
- Surficial Geology
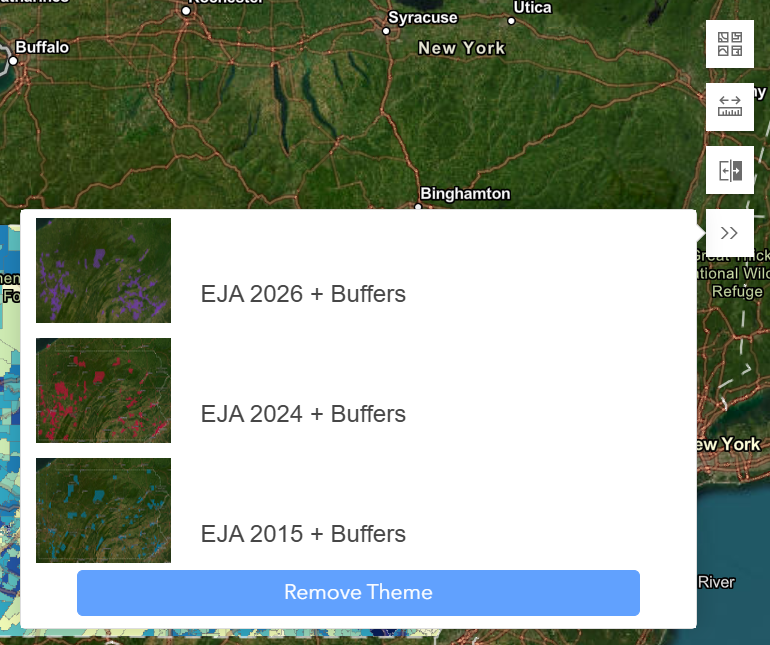
- EJA 2026 + Buffers
- EJA 2024 + Buffers
- EJA 2015 + Buffers
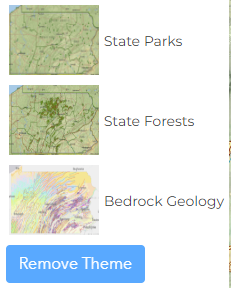
- State Parks
- State Forests
- Bedrock Geology
When one is chosen, the related data layers and it's corresponding basemap will turn on and all other layers will turn off. Simply left-click on the theme you wish to display on the map.
Measurement
The Measurement
widget  is used to
measure the area of
a drawn polygon or
the length of a
drawn line on the
map.
is used to
measure the area of
a drawn polygon or
the length of a
drawn line on the
map.
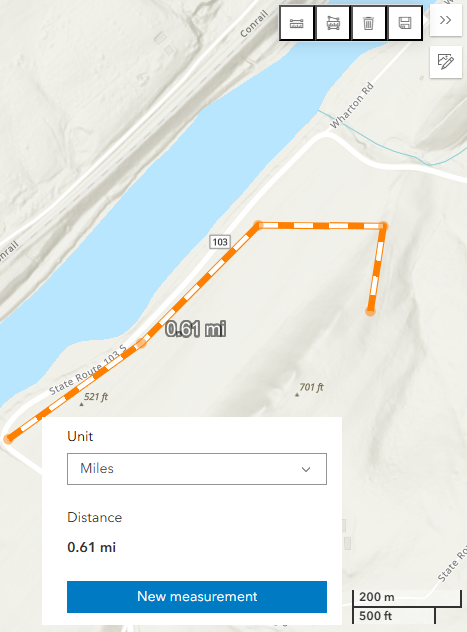
To measure distances:
- Click the Distance measurement button
- Mark the starting point of your line by clicking the left mouse button at that point on the map
- Add waypoints with additional clicks of the left mouse button
- Double-click the left mouse button to finish drawing the line
- Notice that as you move the mouse away from the starting point, a menu appears that displays the units of measurement and the distance
- You may change the units of measurement from the drop-down list in the menu at any time while setting your points, or you may change the units when the line is completed
- To clear the line, click “New measurement” in the pop-up menu or select the trash can in the widget menu
- Click the Area measurement button
- Start your polygon on the map by clicking the left mouse button on the map
- Move the mouse to your next point and left-click again
- Select three or more points in this fashion to draw a polygon
- Double-click the left mouse button to finish drawing the polygon
- Notice that as you move the mouse towards the third point, a menu appears that displays the units of measurement and the area
- You may change the units of measurement from the drop-down list in the menu at any time while setting your points, or you may change the units when the polygon is completed
- To clear the polygon, click “New measurement” in the pop-up menu or select the trash can in the widget menu
Swipe
The swipe tool  allows
you to choose one
basemap and one or more data
layers to compare to
your map display by
swiping (or sliding)
a vertical bar
across the map.
allows
you to choose one
basemap and one or more data
layers to compare to
your map display by
swiping (or sliding)
a vertical bar
across the map.
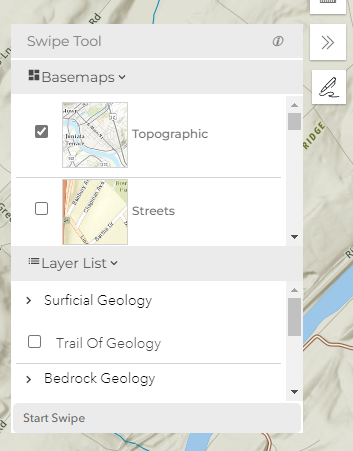 In the Swipe menu:
- Expand the Basemaps list and pick the basemap you want to display
- Expand the Layer List and pick the data layer(s) you want to display
- Click on “Enable Swipe”
- A vertical bar will appear on the map
- Position your mouse over the bar and it will display two outward-pointing arrows
- Hold the left mouse button down and move the mouse to drag the vertical bar to the right or left
- When finished with your exploration of the data, click "Disable Swipe”
Annotate
With the Annotate widget, you can annotate the map with drawing tools located across the top row of the Annotate menu:
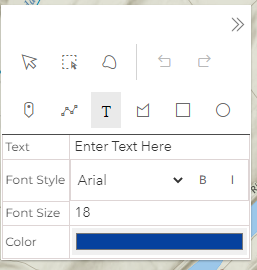
- Add points
- Draw lines and shapes
- Add text
Selecting a tool will open a corresponding style under the drawing tools that allow you to choose colors, sizes, line weights, and so on, as appropriate to the item being added.
The left side of the top row of the Annotate widget has feature selection tools that allow you to grab and move or select an annotation item for style changes. The right side of the top row has undo and redo choices.
Search Results Table
The collapsible search result tables that appear at the bottom of the screen allow users to review data associated with searched elements. The tables are custom built to allow user interaction, including the following:
- Choose which fields to display using the Show/Hide Columns button
-
Sort results alphabetically / numerically(click the up-down SortBy arrows in a column heading)
-
Filter / Search results with free text(click the funnel icon in a column heading)
- Export results to a CSV file
- Clear any previously set filters and sorting by clicking on the refresh arrow
-
Close the results table(click on the “x” to the right of the table name in the upper left tab)
- Click on a record to zoom to and highlight the selected feature on the map
The Print tool in the left sidebar allows users to create a map in a choice of several file formats. Clicking the blue Export button near the bottom of the Print widget screen will generate the specified map and place the file in the last tab called Exports. Selecting the file will open it in your browser to be viewed, downloaded, or printed as desired.
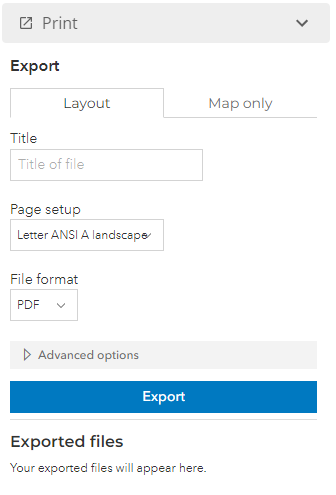
There are three tabs for the print function: Layout, Map Only and Exports. The Layout option will allow for the addition of a legend, north arrow, map title, and author. The Map Only option will only print the map without those elements.
If printing with the Layout tab, then the following inputs are available:- Title: Title to appear over the map and to be used as a file name in the exported files list.
- Page setup: Drop-down list of page sizes (American National and International Standards) and orientations (i.e., portrait or landscape)
- File format: Drop-down list of several raster and vector file formats
- File name: Name to be used as a file name in the exported files list
- File format: Drop-down list of several raster and vector file formats
- Width: Desired width (in pixels) of the created map (dividing by the DPI will give the width in inches)
- Height: Desired height (in pixels) of the created map (dividing by the DPI will give the height in inches)
- Set Scale: This
is the desired
scale for the
created map as
represented by
the scale
ratio’s
denominator and
should be
entered to the
nearest whole
number
- A scale denominator cannot be entered in the text box unless the box beside “Set scale” is checked
- If unchecked, the map will be created close to the scale shown by the map view
- The scale of the map on the application screen can be viewed by clicking the refresh-arrows symbol beside the set-scale text box
- The created map extent will depend on the scale chosen and the paper size
- The created map will be centered on what is visible on the screen
- If the set scale is outside of the zoom-level range for displaying a data layer visible on the map screen, then the data will not show on the created map
- On a map created with Layout, a scale ratio over a scale bar will be shown on the right side immediately under the lower bottom edge of the map
- Author: Entered text will appear in the lower right corner of the created map (only available with Layout)
- Copyright: Entered text will appear under the Author text in the lower right corner of the created map (only available with Layout)
- DPI: desired dots per inch (resolution) for the created map
- Include legend: If checked, this will show a legend for the map (only available with Layout)
- Include north arrow: If checked, this will show a north arrow on the map (only available with Layout)
- Include attribution: If checked, this will show abbreviations or full names of organizations providing information shown on the map (only available as an option with Map Only—attributions always show in the lower right corner of the created map with the Layout option)
Download Data
This left sidebar widget lets users know that they can download data via the PA DCNR Authoritative Geospatial Open Data website. It provides a link to the website, which is located at
Pa Open Data PortalThis left sidebar widget lets users know that they can download data via the PA DEP Authoritative Geospatial Open Data website. It provides a link to the website, which is located at
PA Open Data PortalBookmarks
The Bookmark component is designed to save the current state of the map, including the extent or zoom level, visible layers, and the current selected basemap. Additionally, it captures a screenshot of the current map.
Creating Bookmarks
- Navigate to the desired location on the map and set the desired zoom level, visible layers, and basemap.
- Click on the 'Add Bookmark' button to open the bookmark creation dialog.
- Enter a title (up to 25 characters) and a description (up to 50 characters) for the bookmark.
- Click 'Save' to create the bookmark.
- Bookmarks are stored in your browsers database, they are not cleared when you clear your cache.
- Bookmarks are browser specific, in other words bookmarks stored in Chrome are not available in Edge or Firefox.
- To permanently save a Bookmarks, export it and save the file. Follow Exporting Bookmarks in the following section.
Exporting Bookmarks
- Click on the 'Export Bookmarks' button.
- Select a location to save the bookmark file (JSON format).
- Share the exported bookmark file with other users, who can then import the bookmarks into their application.
- Note: Sharing is best when used between the same maps, as applications have different layers
Importing Bookmarks
- Click on the 'Import Bookmarks' button.
- Select the bookmark file (JSON format) you received from another user or previously exported.
- The imported bookmarks will be added to your list of bookmarks.
Clearing your Cache and Bookmarks
- Clearing your cache will not clear your bookmarks.
Deleting Bookmarks
- Locate the bookmark you wish to delete from the list of bookmarks.
- Click on the 'Delete' button next to the bookmark.
- Confirm the deletion when prompted.
Note: Deleted bookmarks cannot be recovered.
Add User Data
The Add User Data widget in the left sidebar allows users to add data files of their own to the map. After data is added, the widget will try to zoom the map to the extent of the new data. The added data is also saved in memory to allow for restoration if the user closes the application. In the widget, users will see tabs to either "Upload file" or "Add From URL".
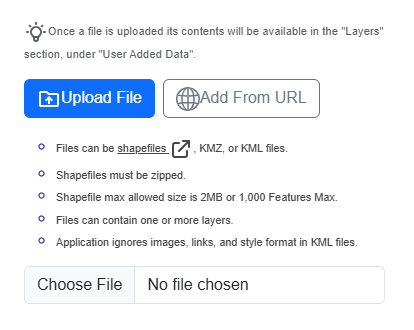
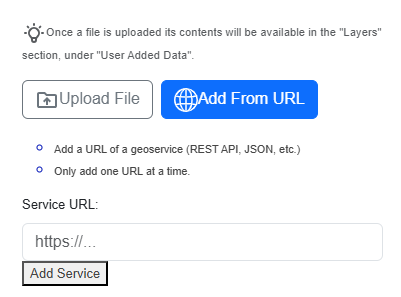
Upload File
The upload file tab has several bullet points that explain some of the limitations of the widget as well as what file types it supports. At the bottom is a button called "Choose File". Clicking here will open a file explorer for users to select the file they wish to add to the map.
Add From URL
The add from URL tab has bullet points explaining to users what URL to add and that they can only add one at a time. At the bottom is an input box where users can put the URL and then click the "Add Service" button to add it to the map.
Saved User Added Data
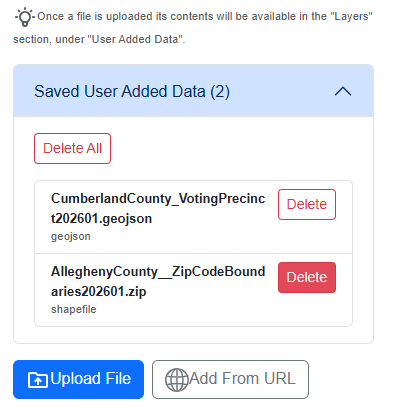
After data is added via the widget a new section called "Saved User Added Data" is added in the widget. This section allows users to delete specific data that they added or delete all the data added via the widget. This deletion does it to the map and the memory for restoration. It works similar to the bookmark's component.
Citation
Pennsylvania Geological Survey, 2023, PaGEODE—Pennsylvania geologic data exploration: Pennsylvania Geological Survey, 4th ser., https://gis.dcnr.pa.gov/pageode/. [Accessed on ]
Contact
To ask questions or to report issues found with the application, please use the Feedback functionality found at the top of a computer screen and in the menu of a mobile device. You will receive an emailed reply.
If you have any questions that are not covered in this help documentation, or find an issue with the documentation, please send an email to CEDCGIS@pa.gov